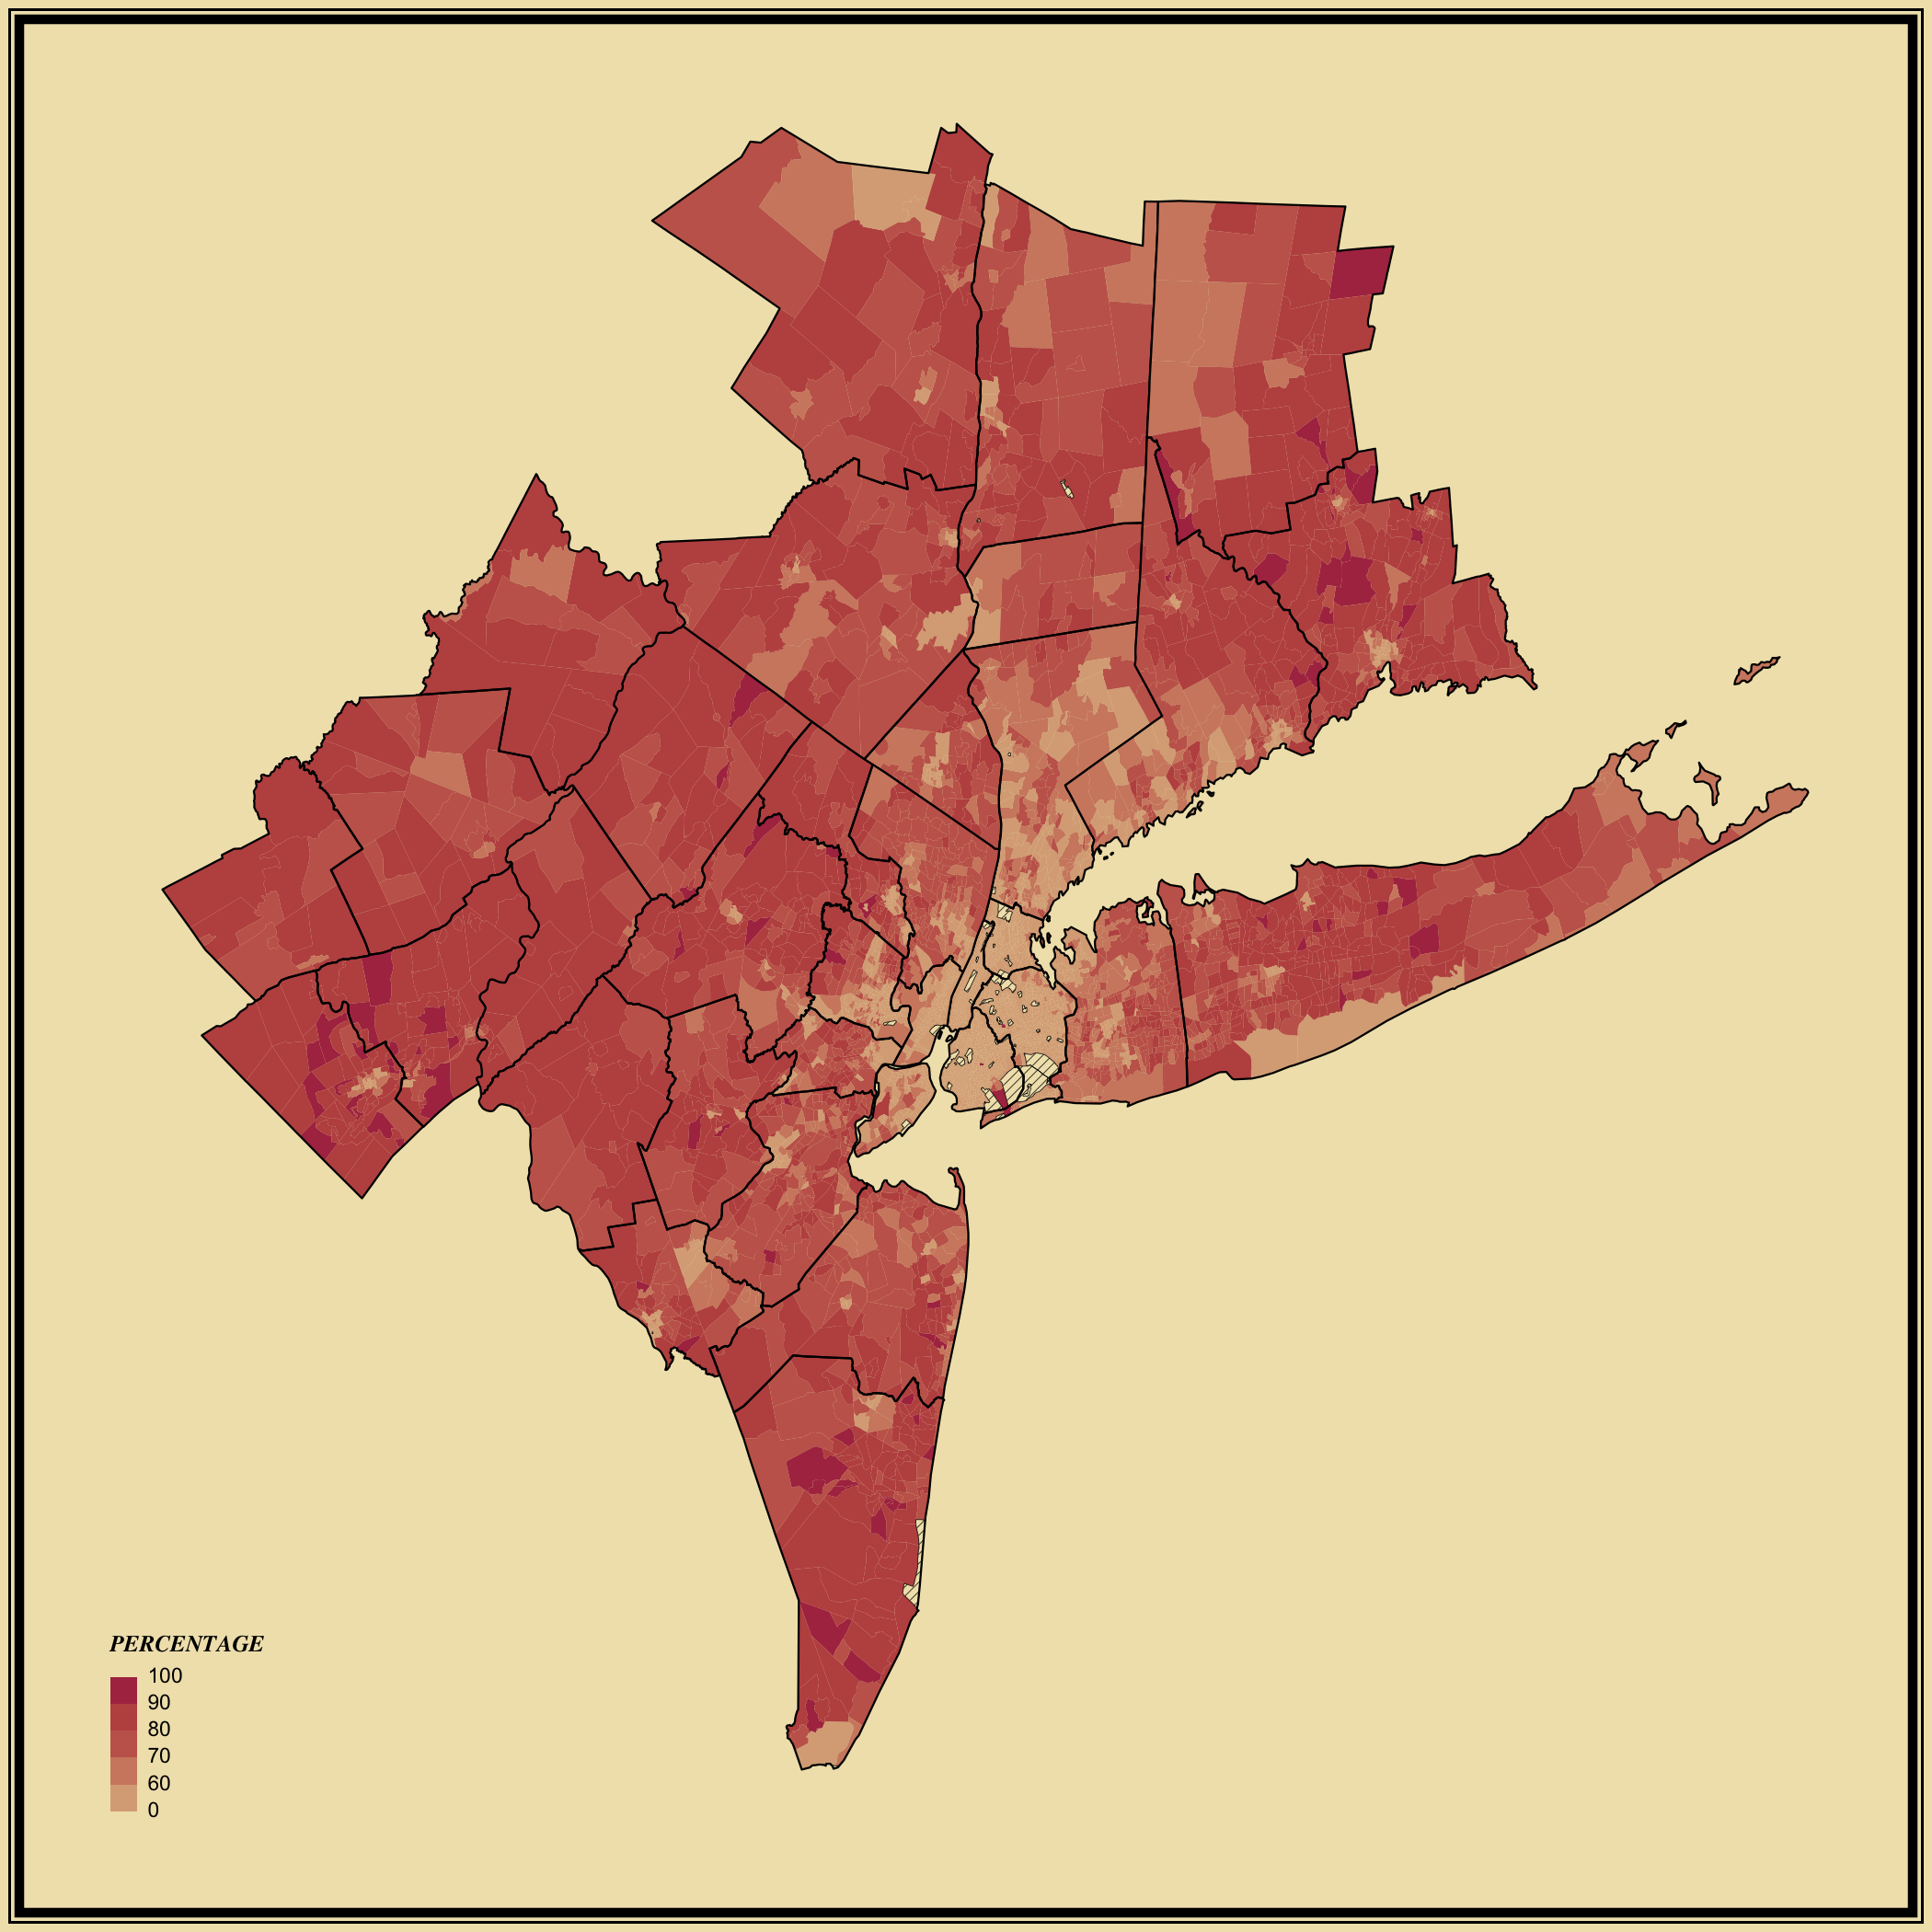
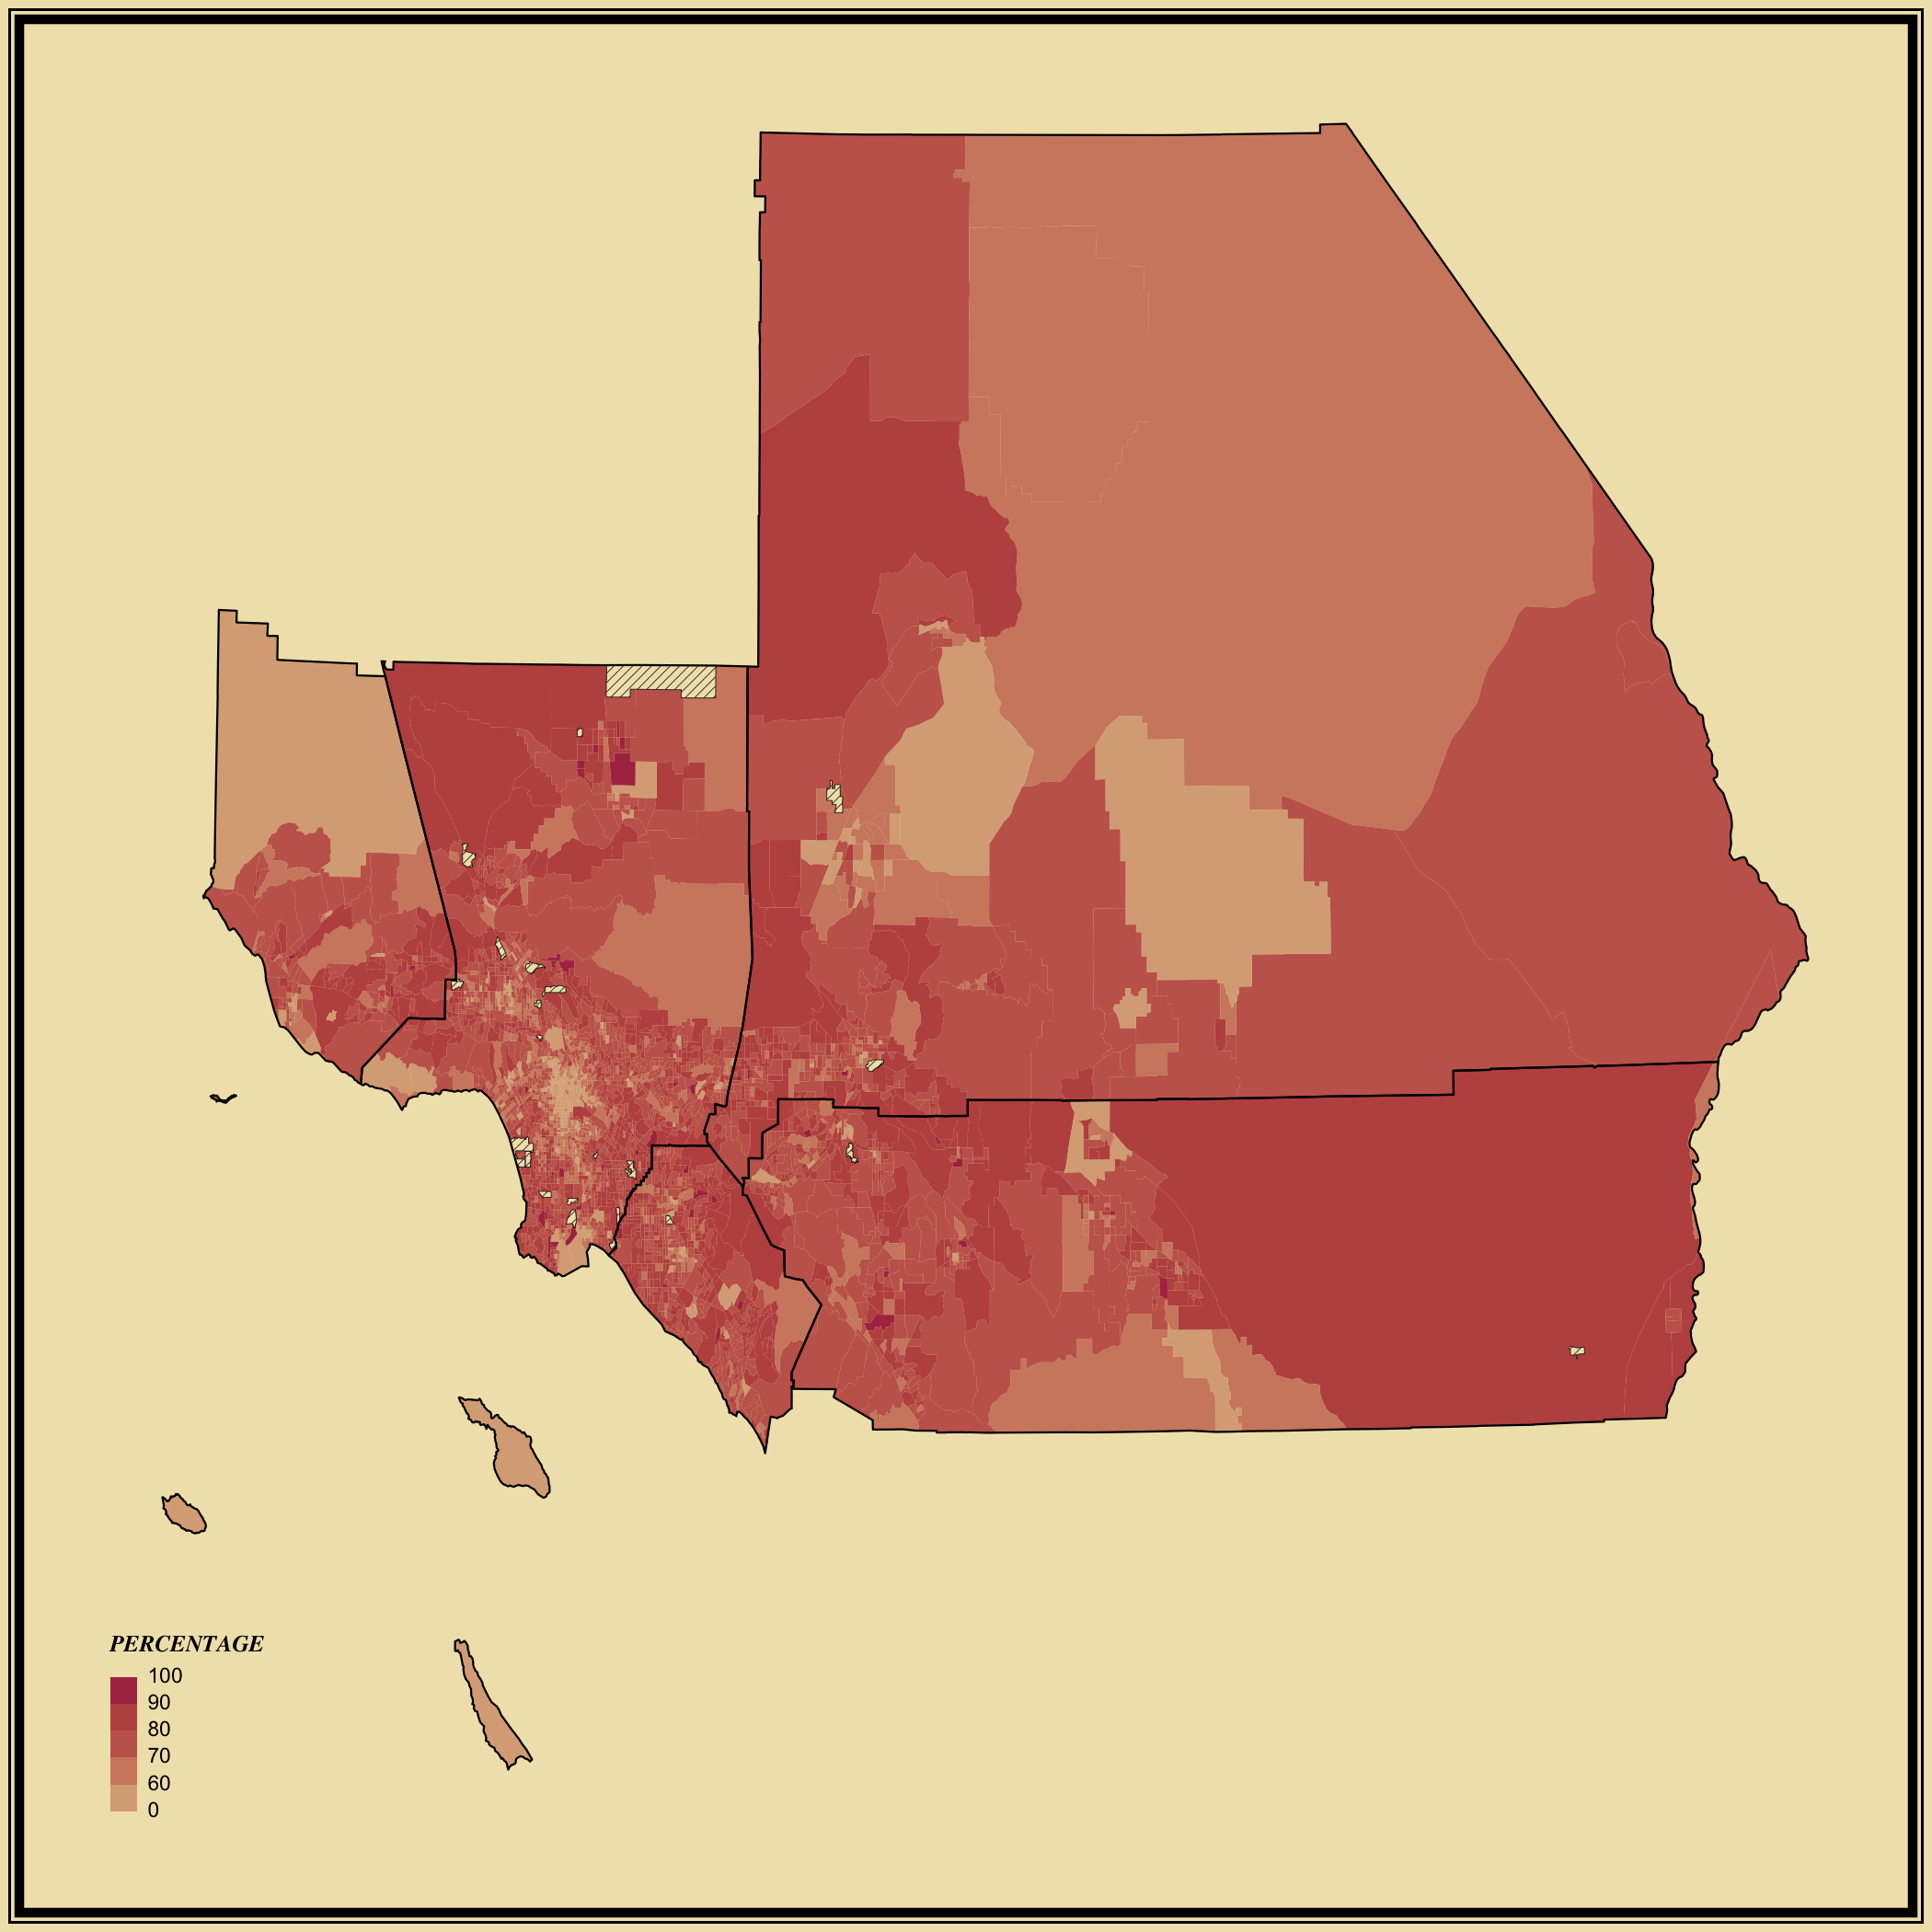
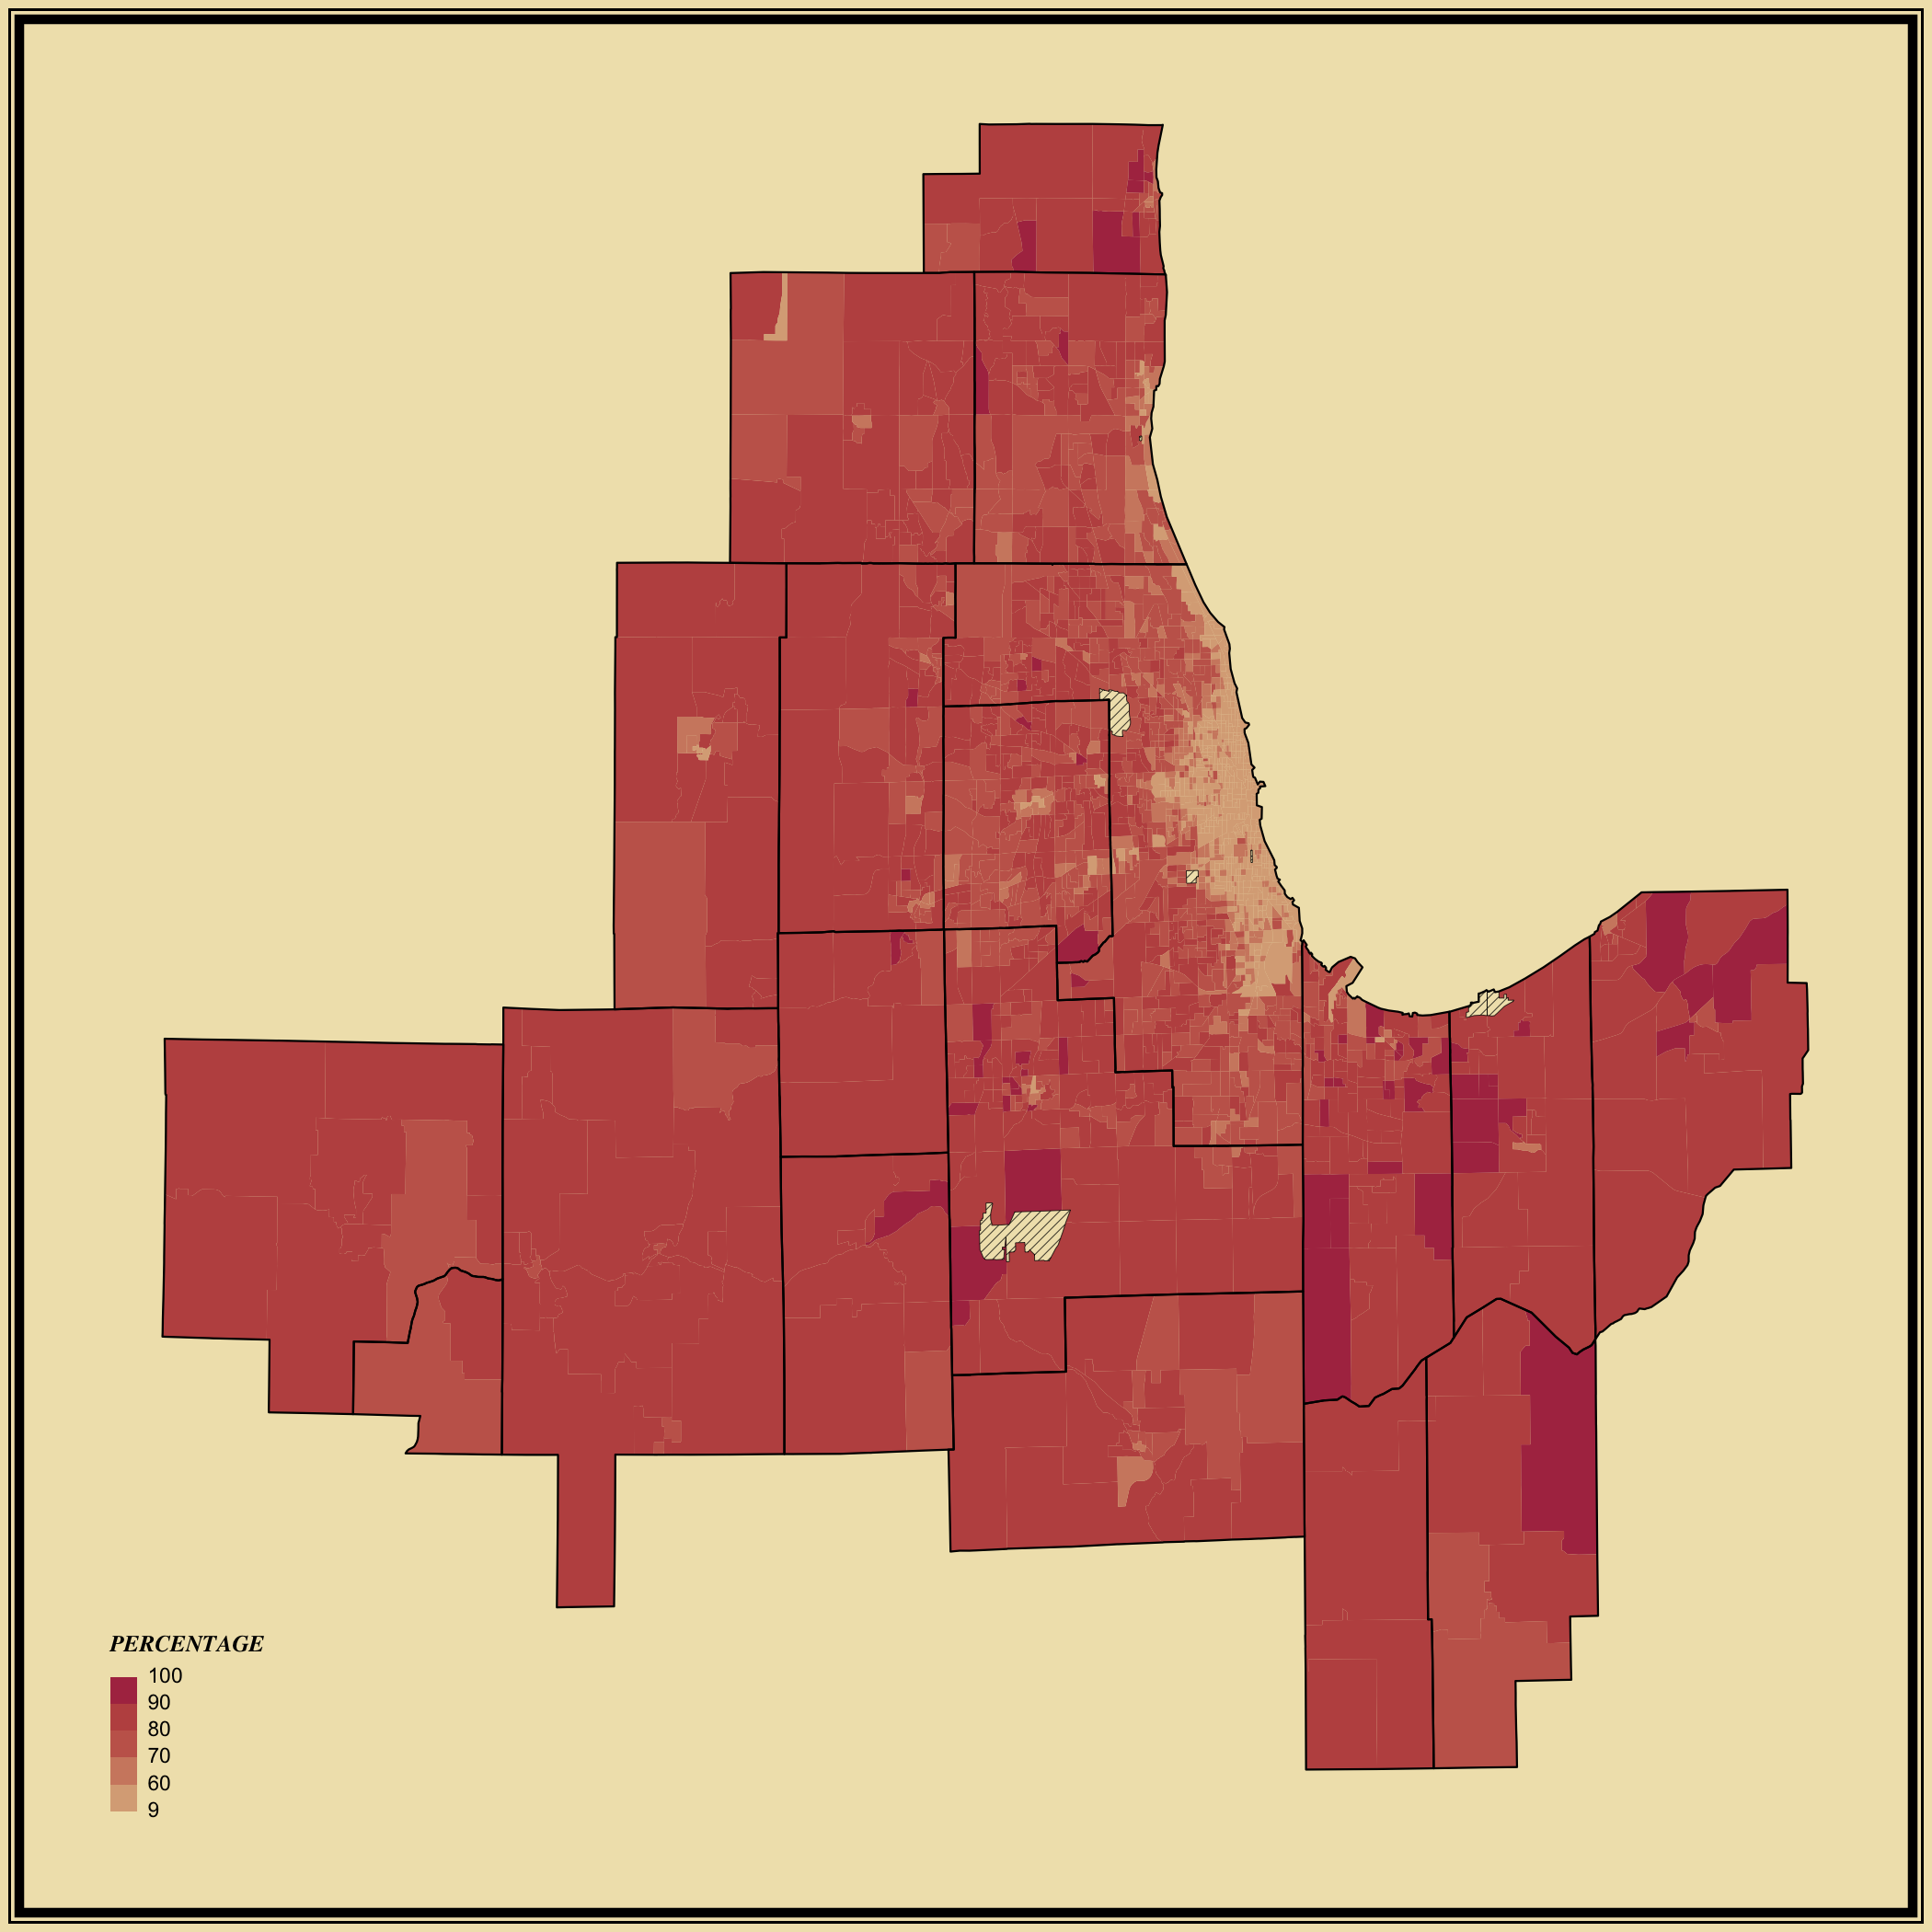
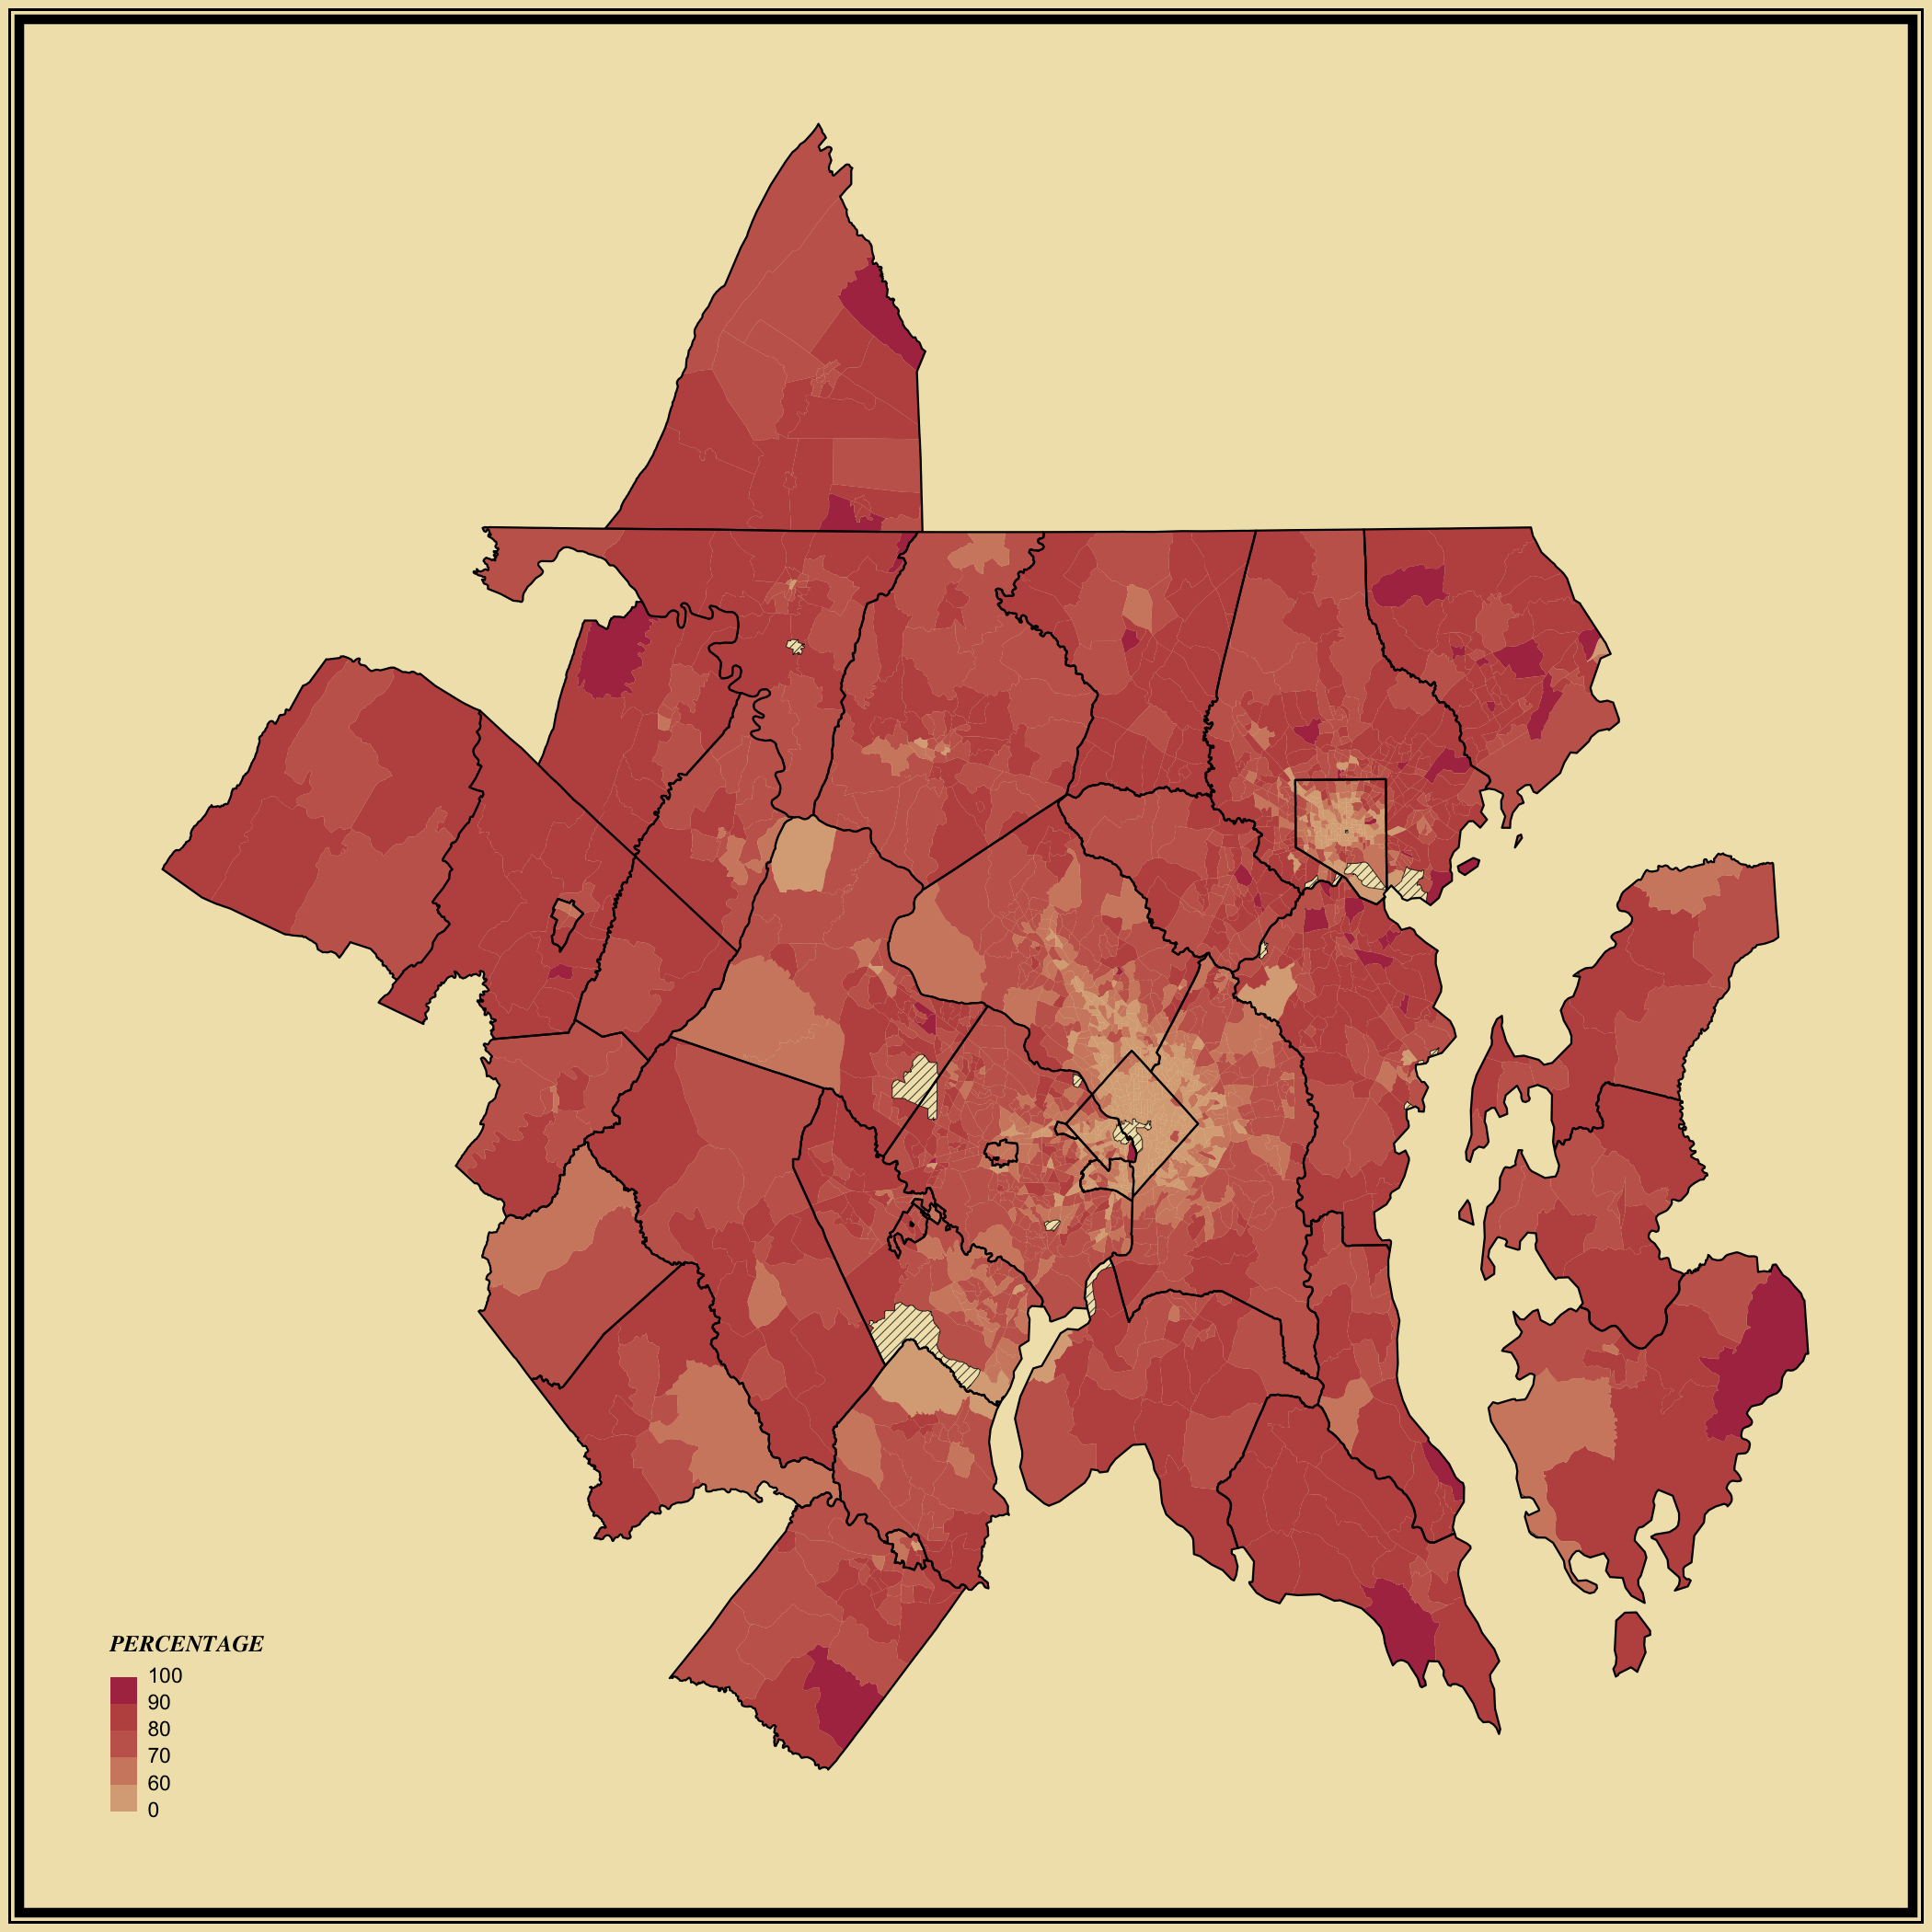
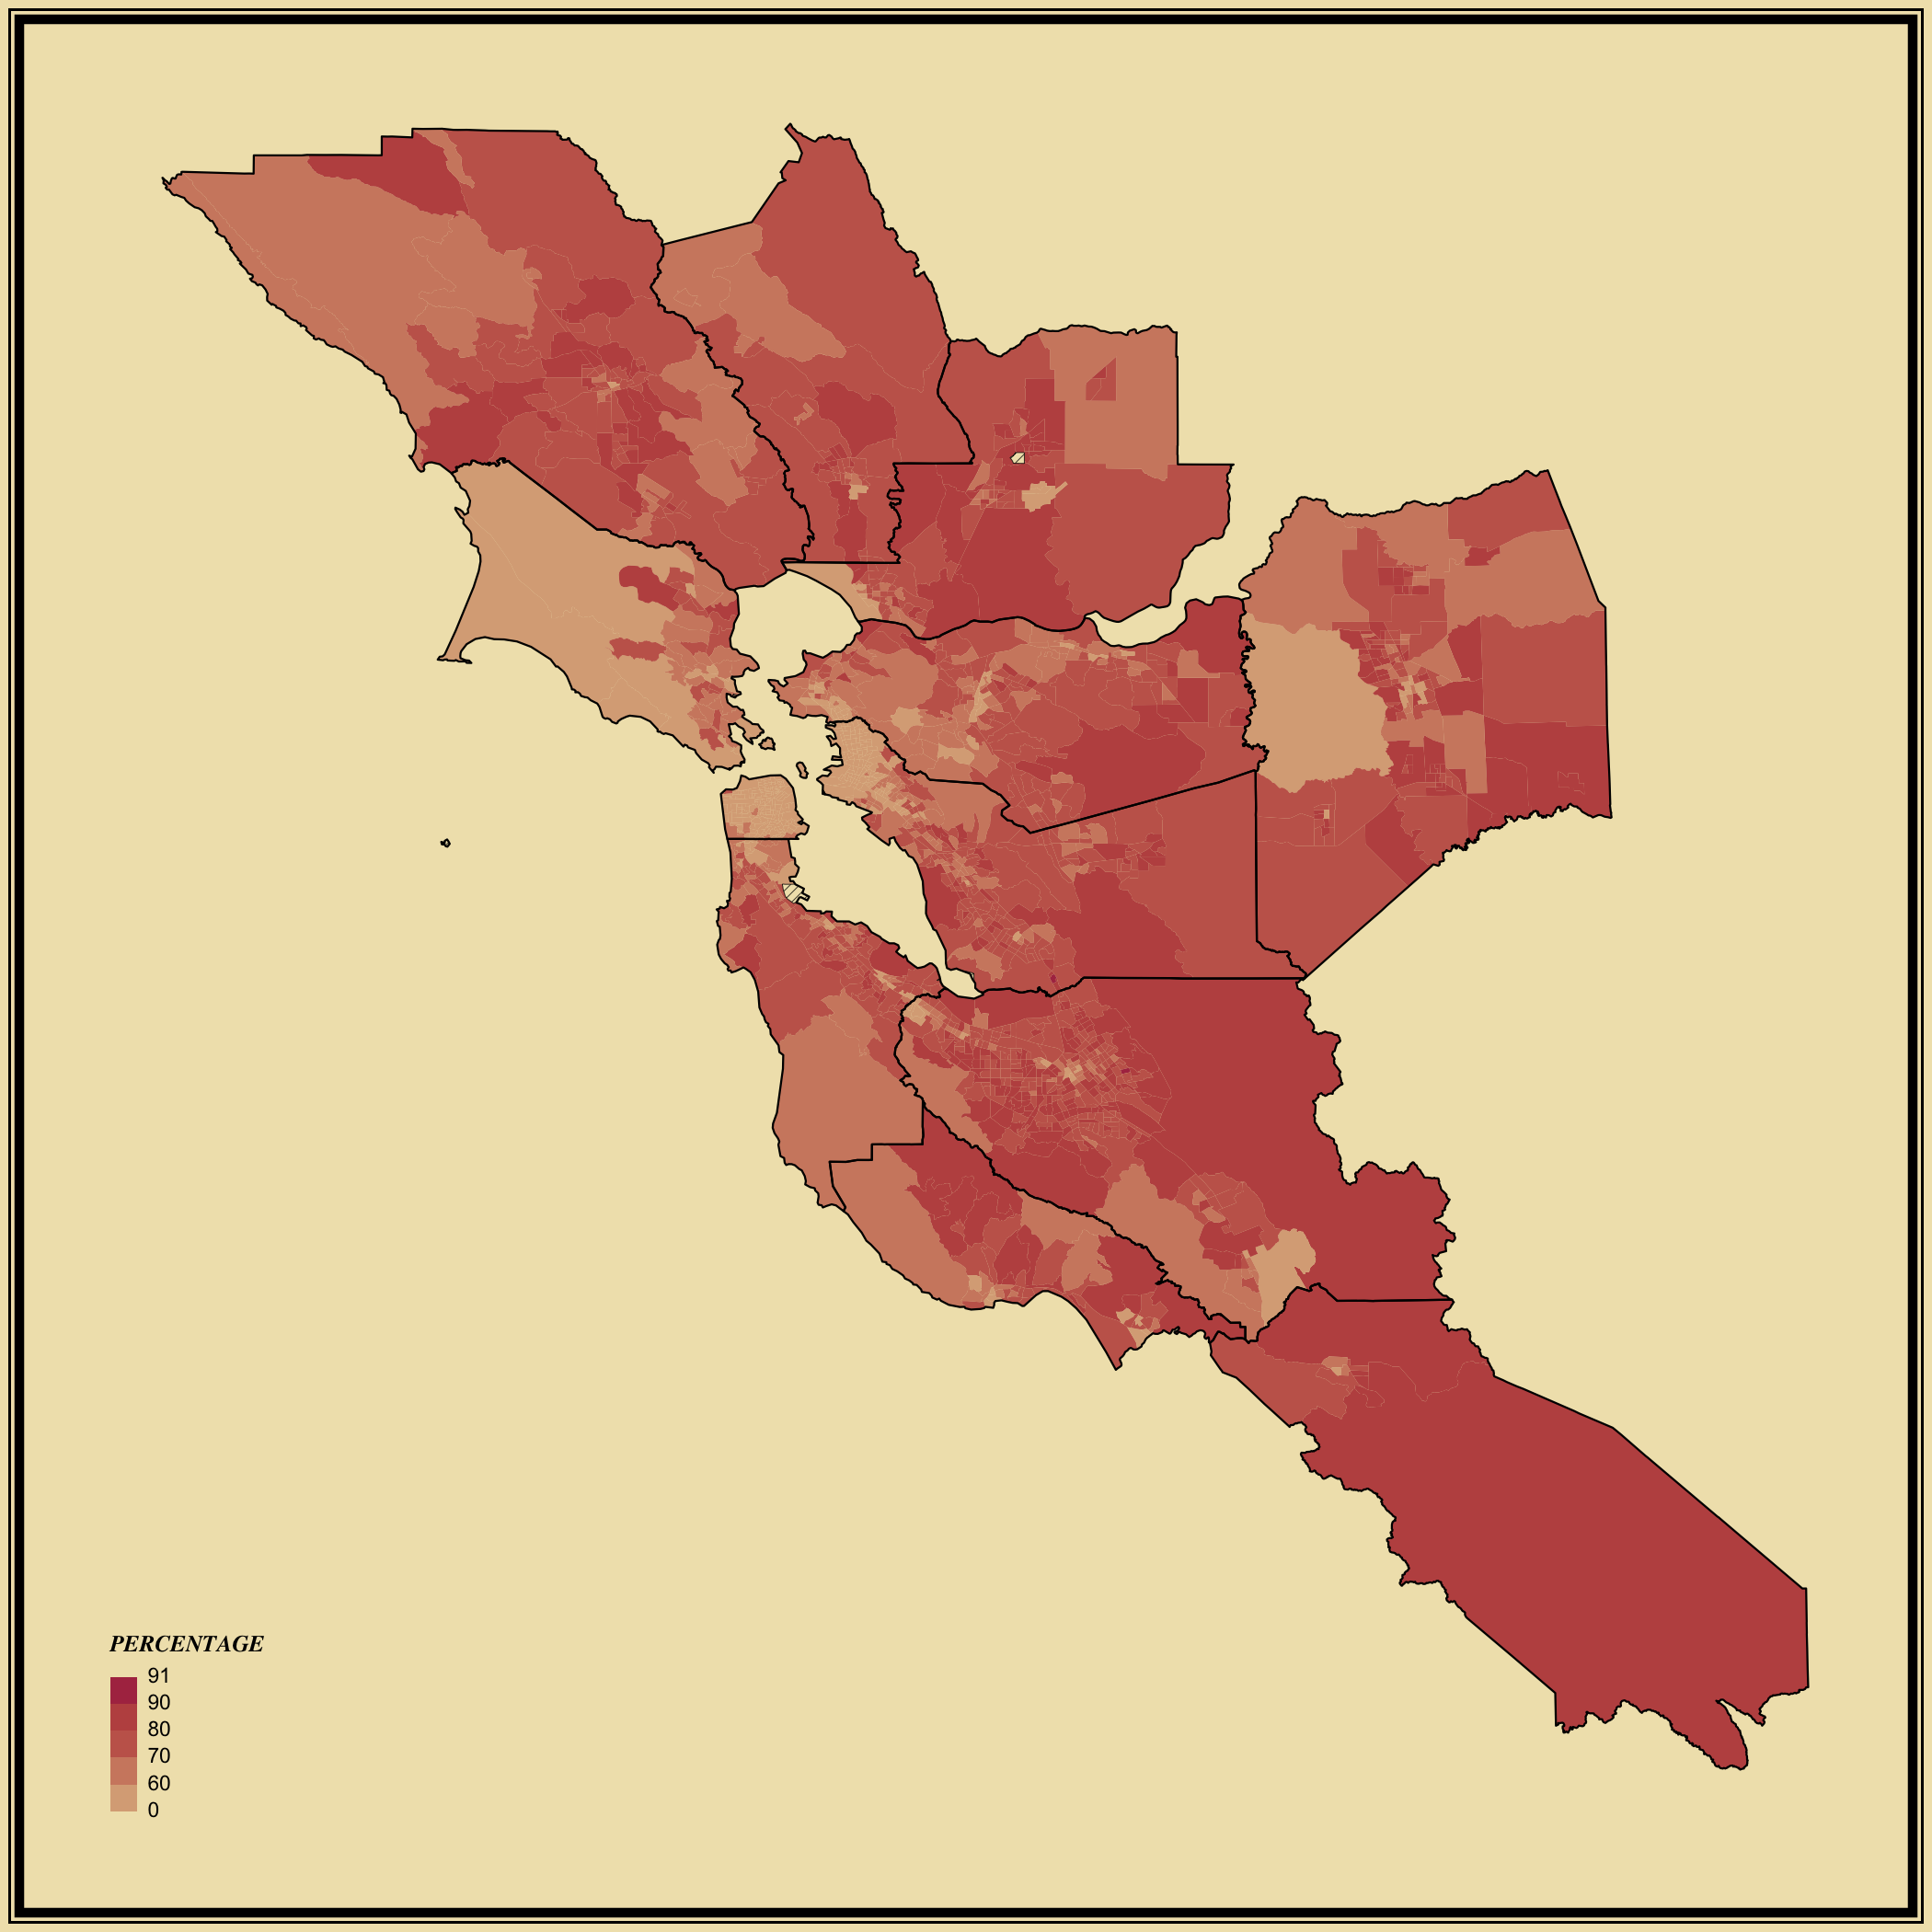
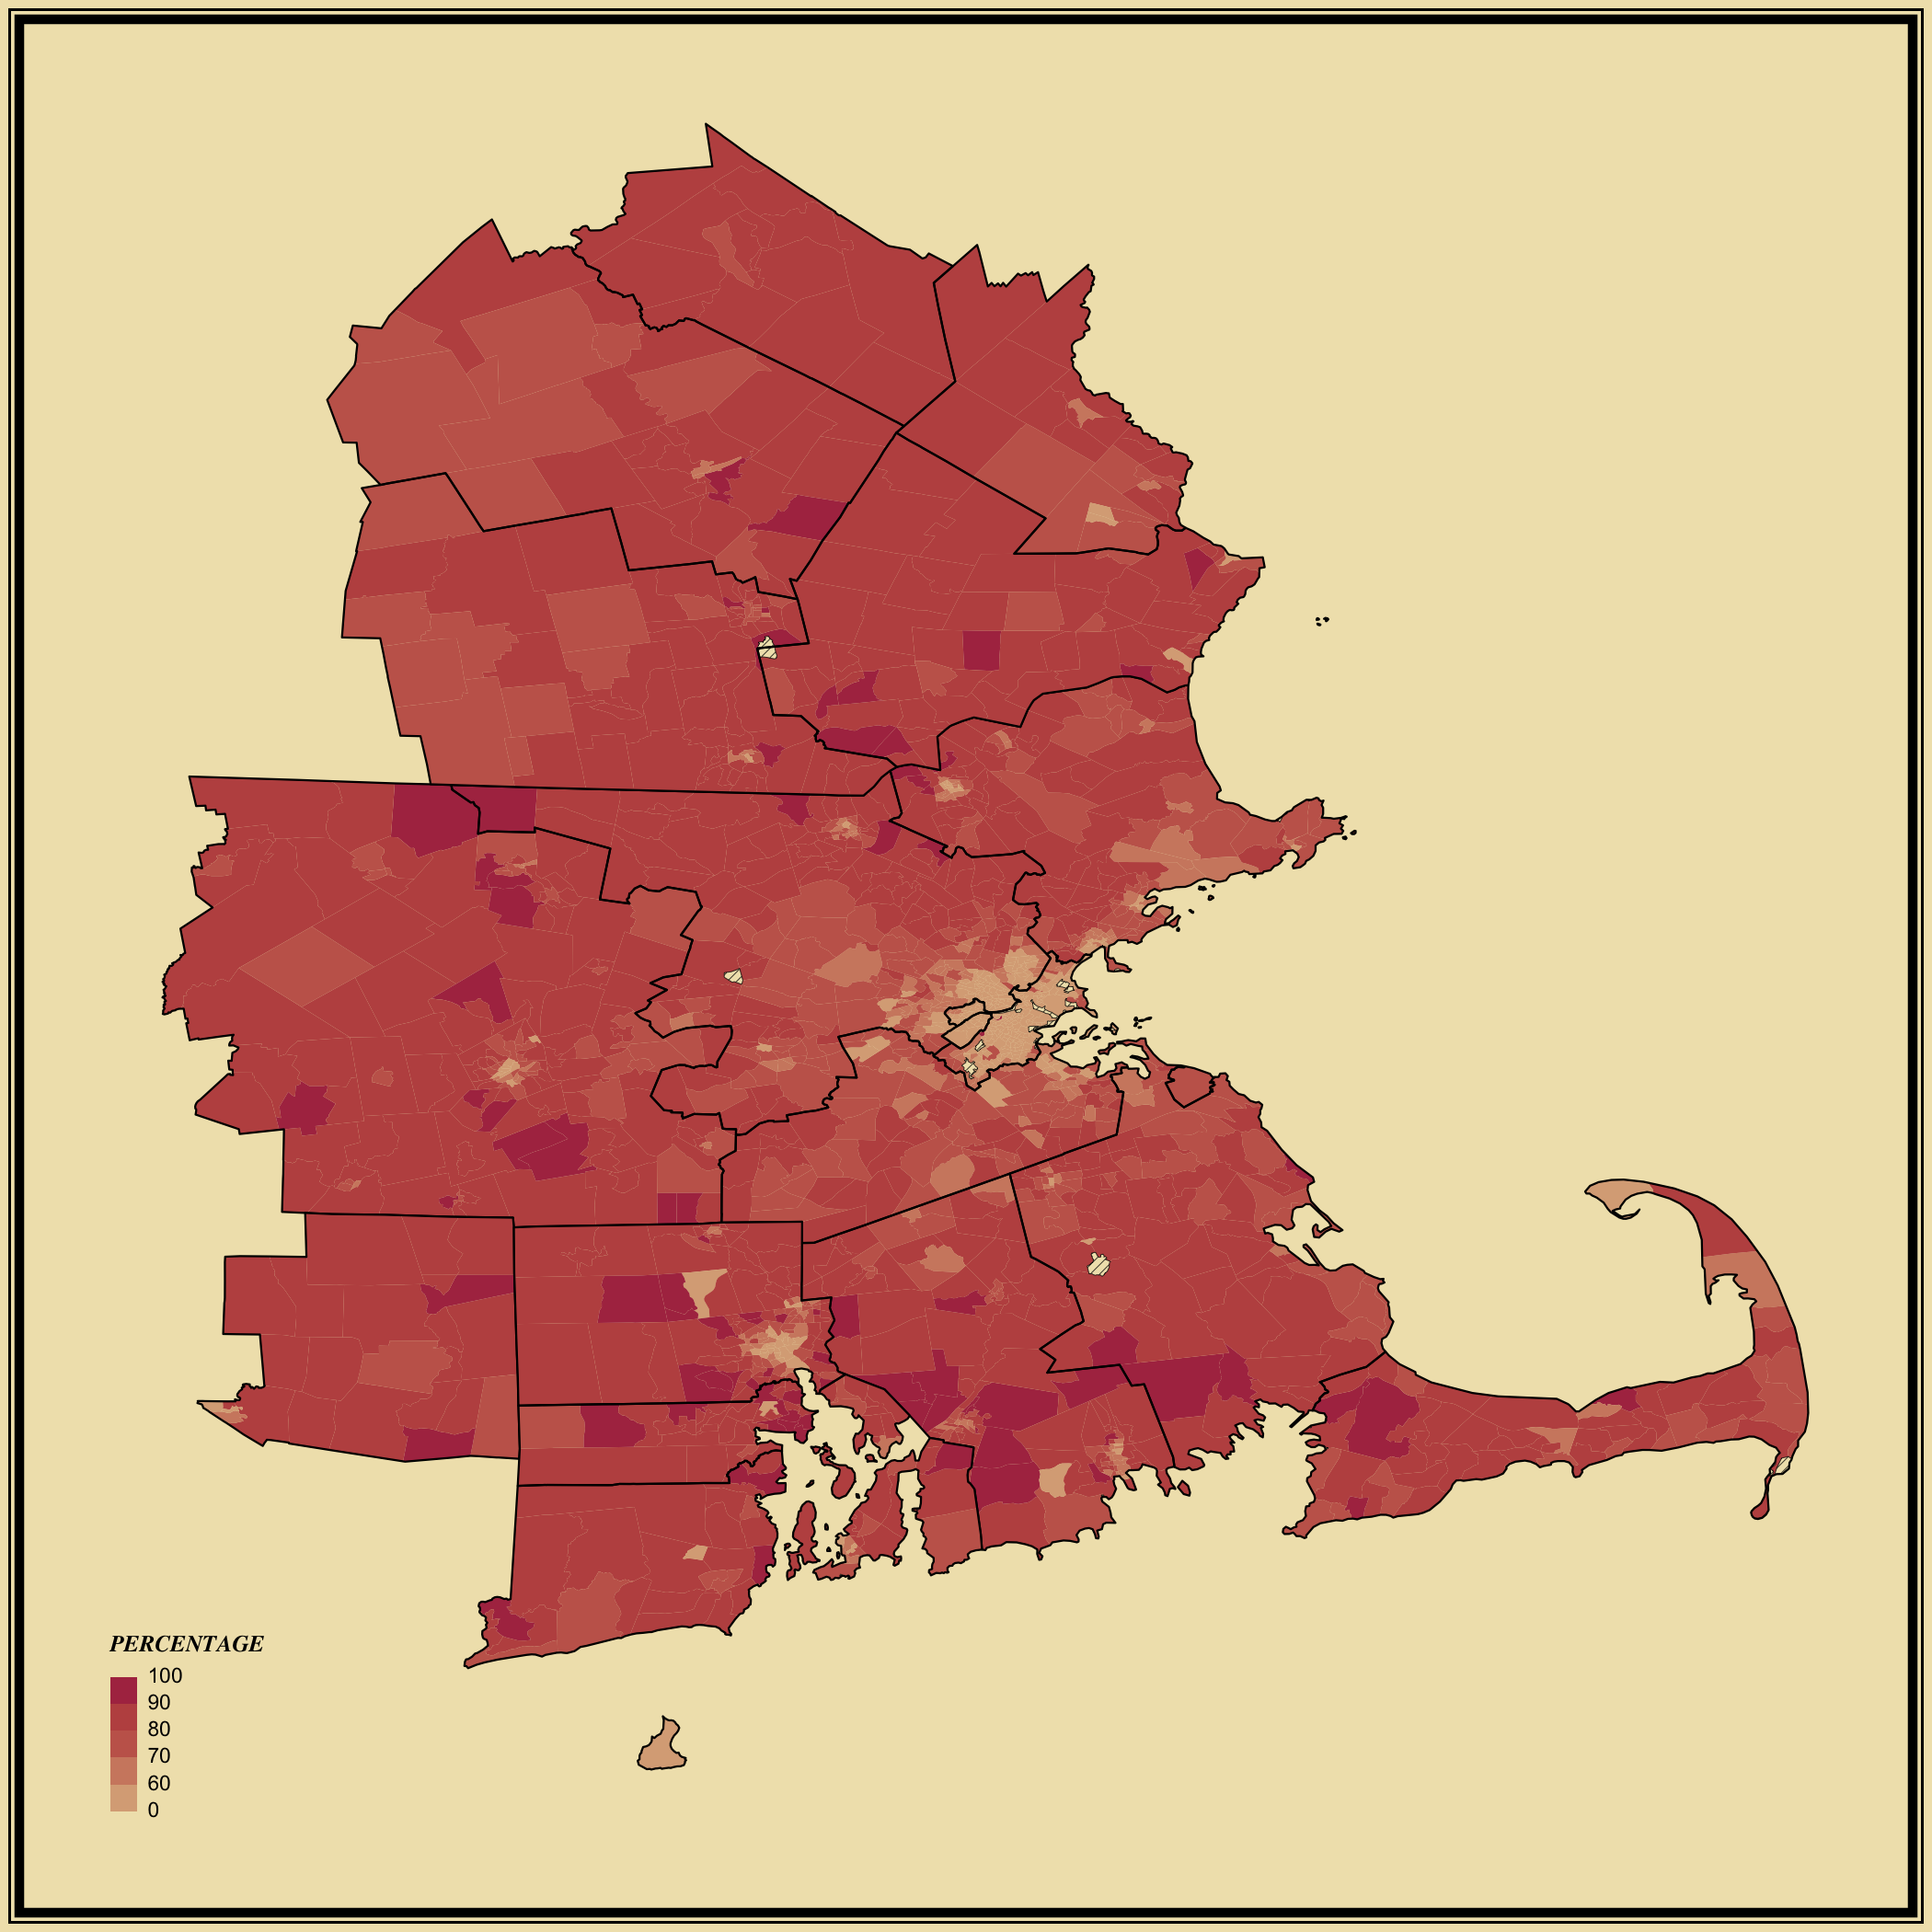
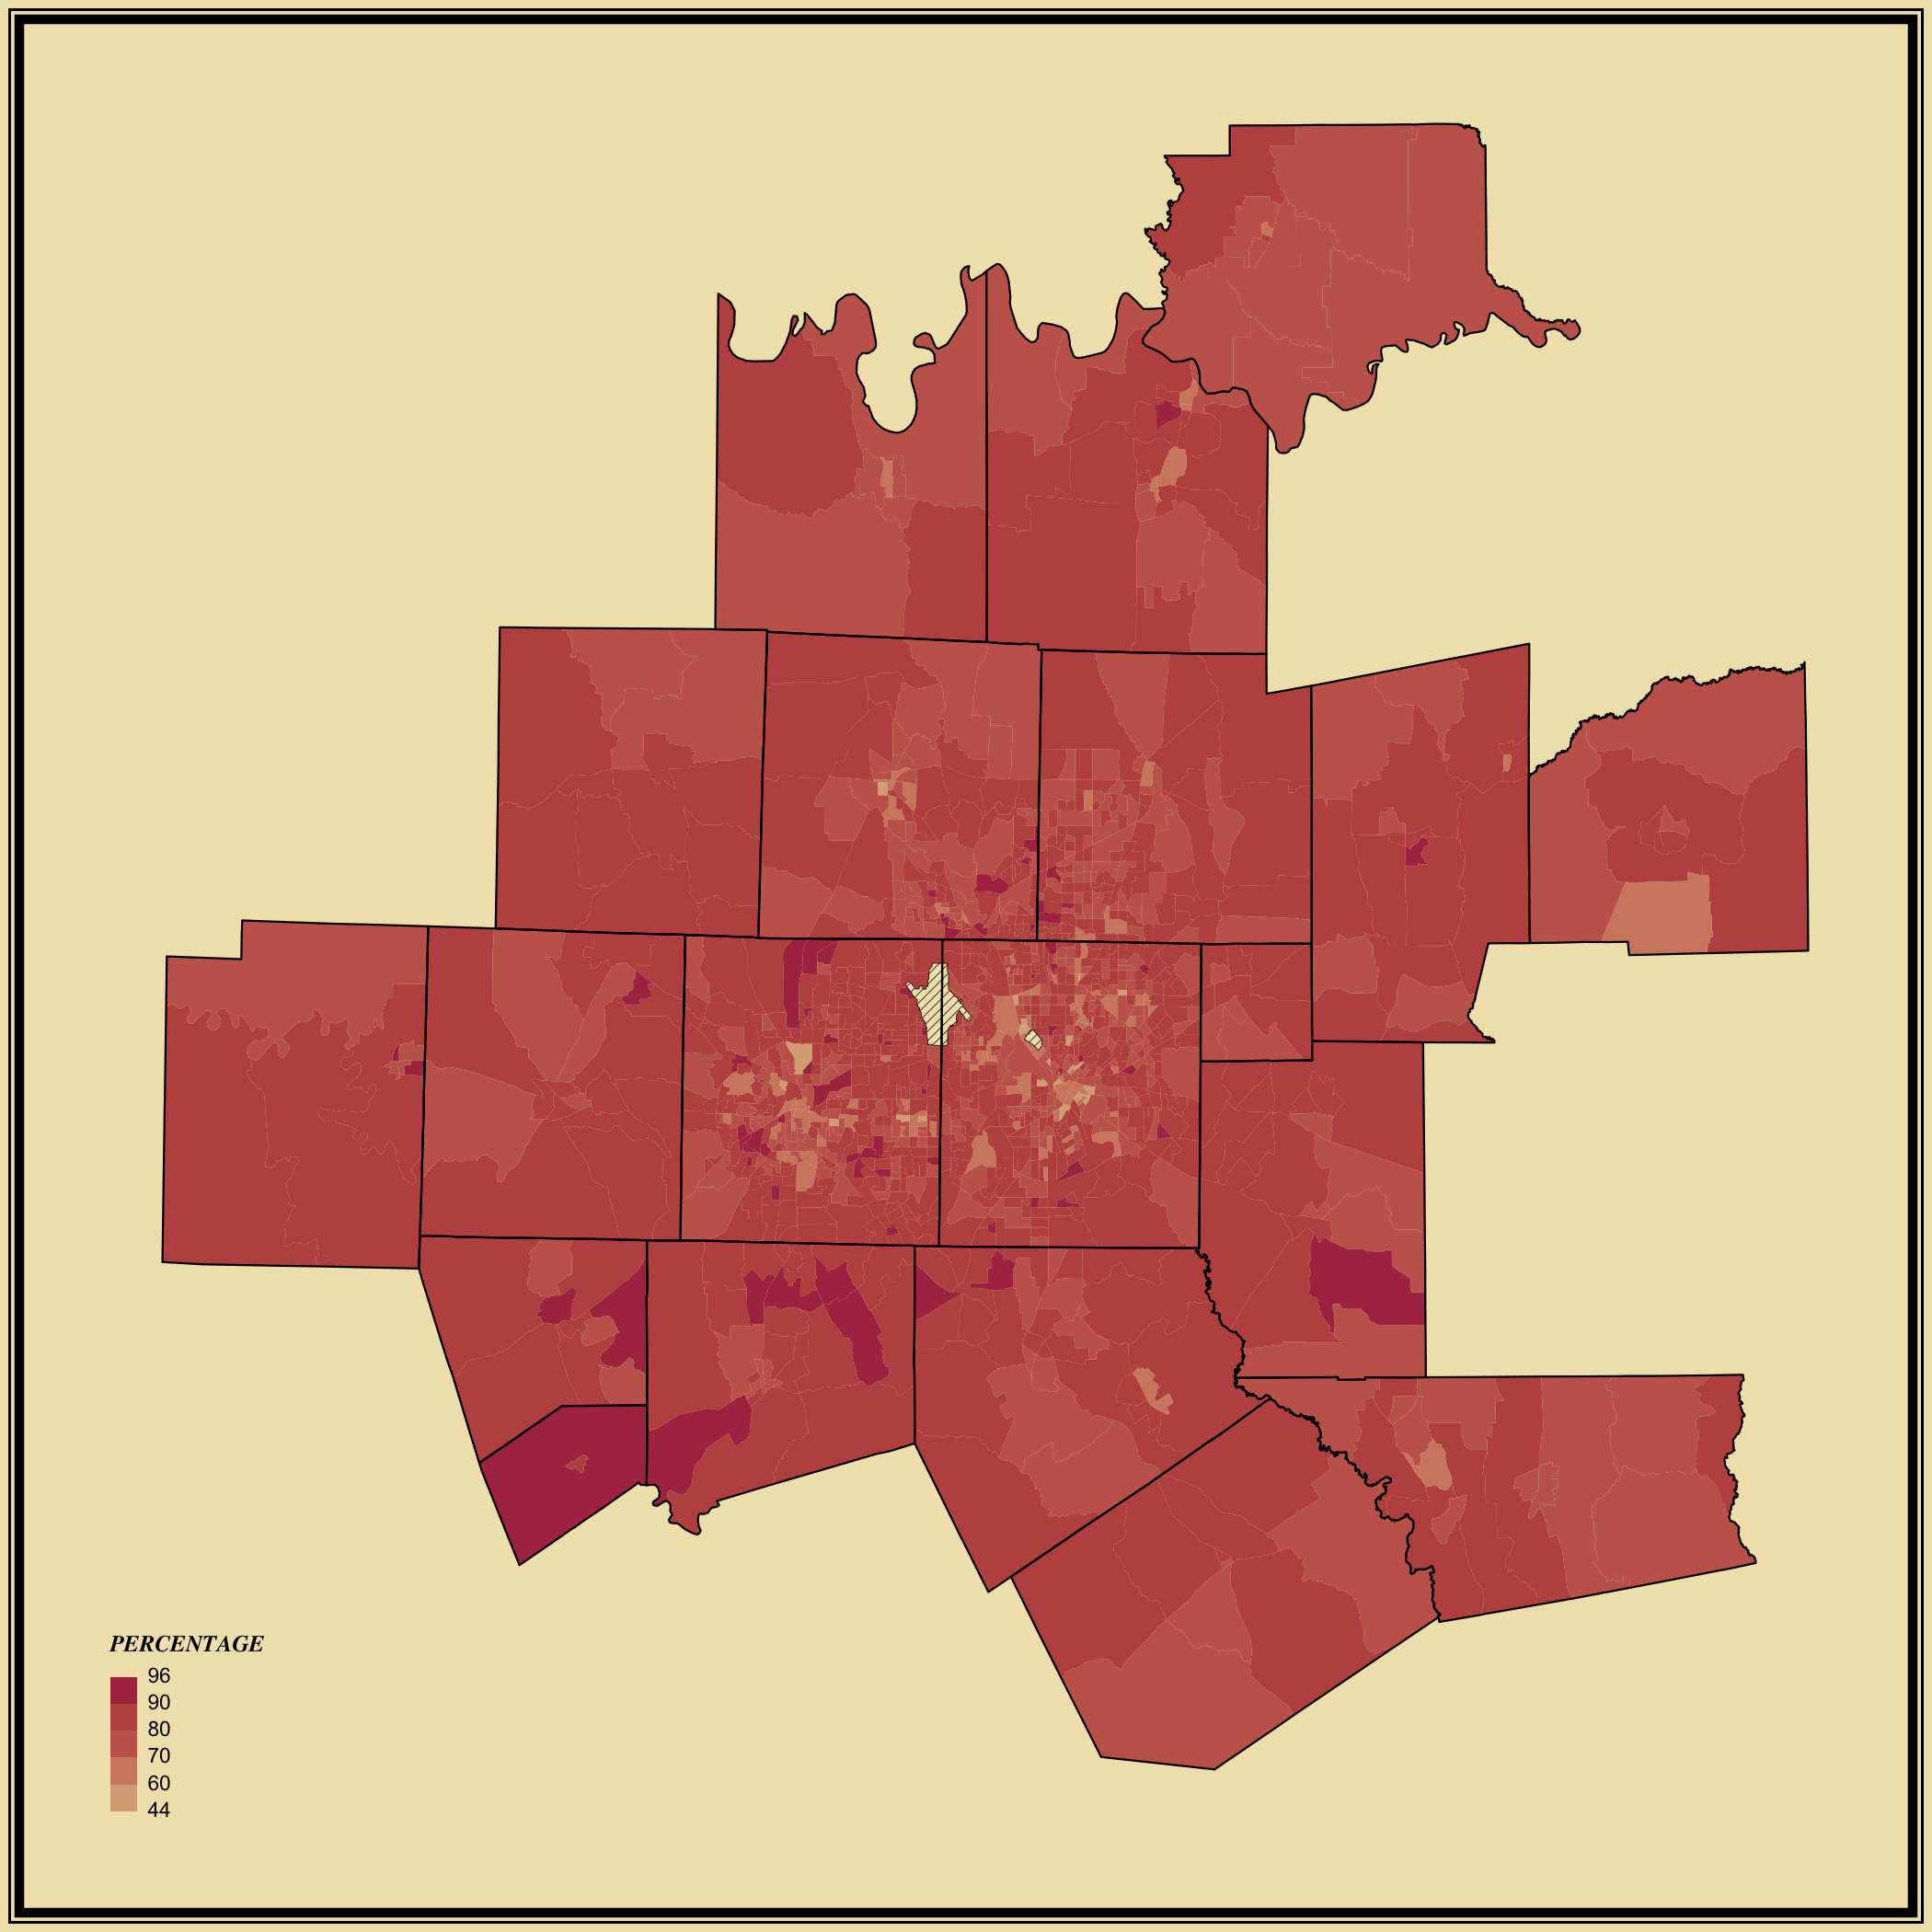
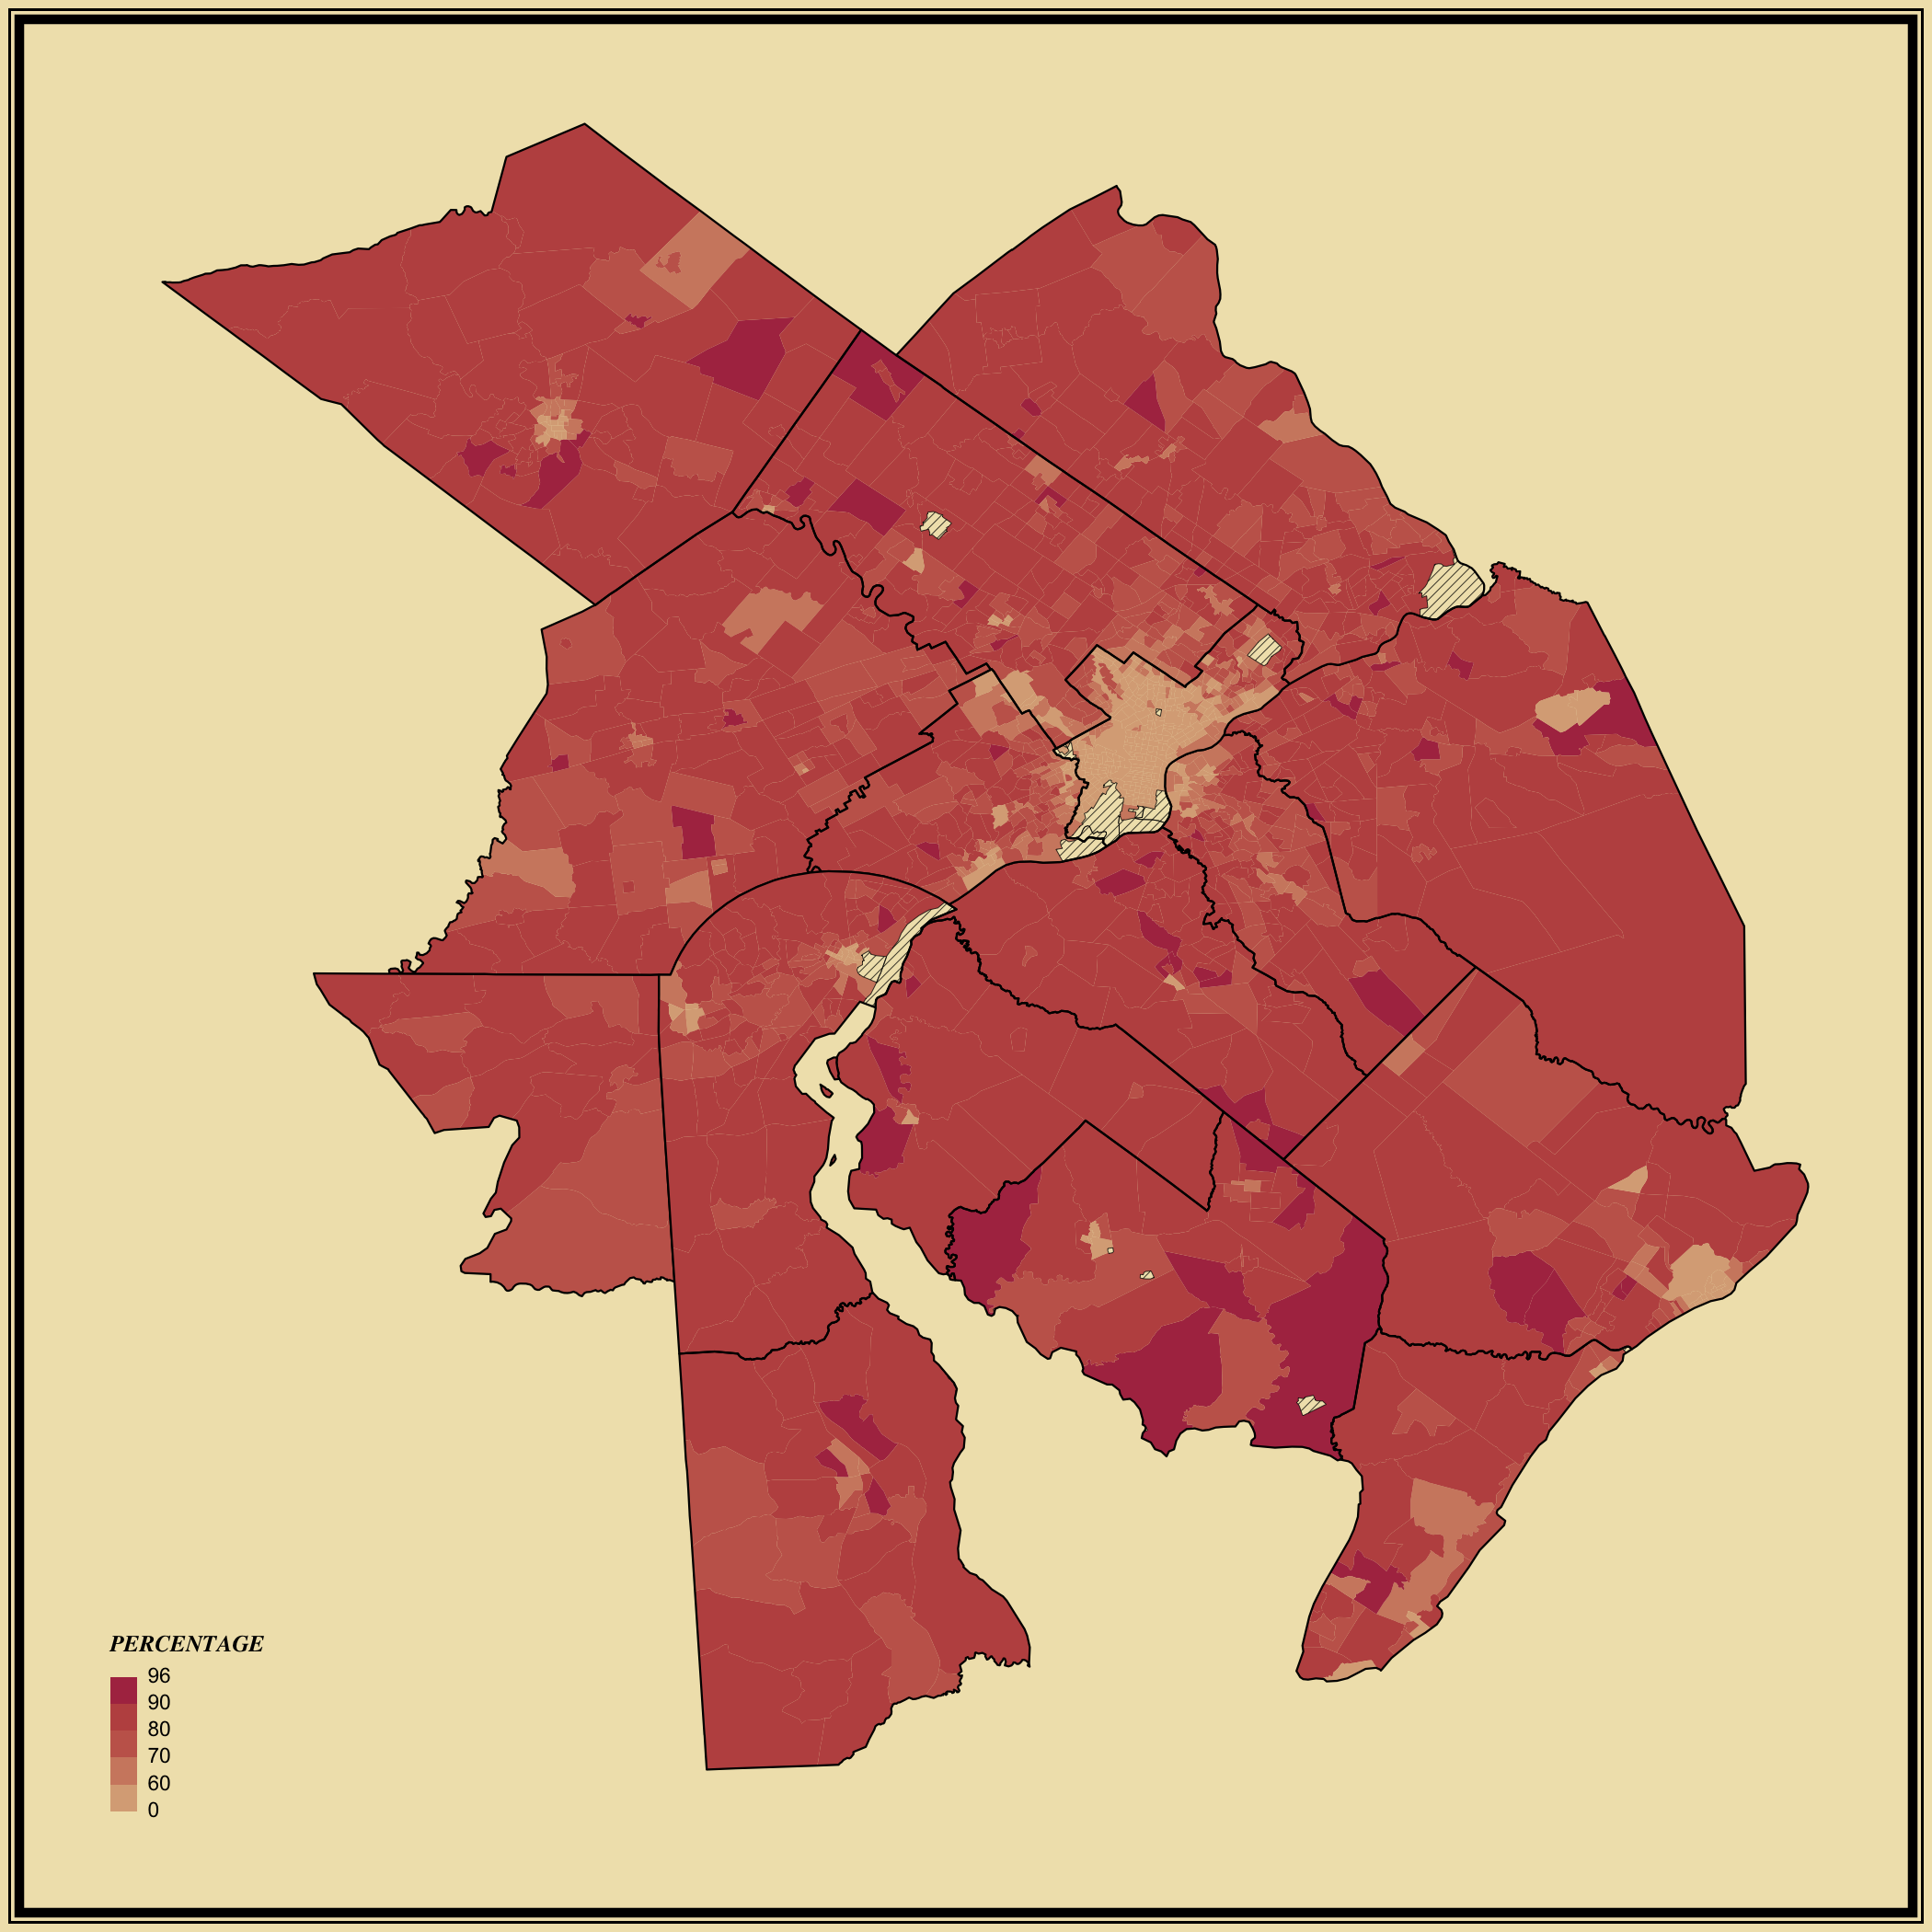
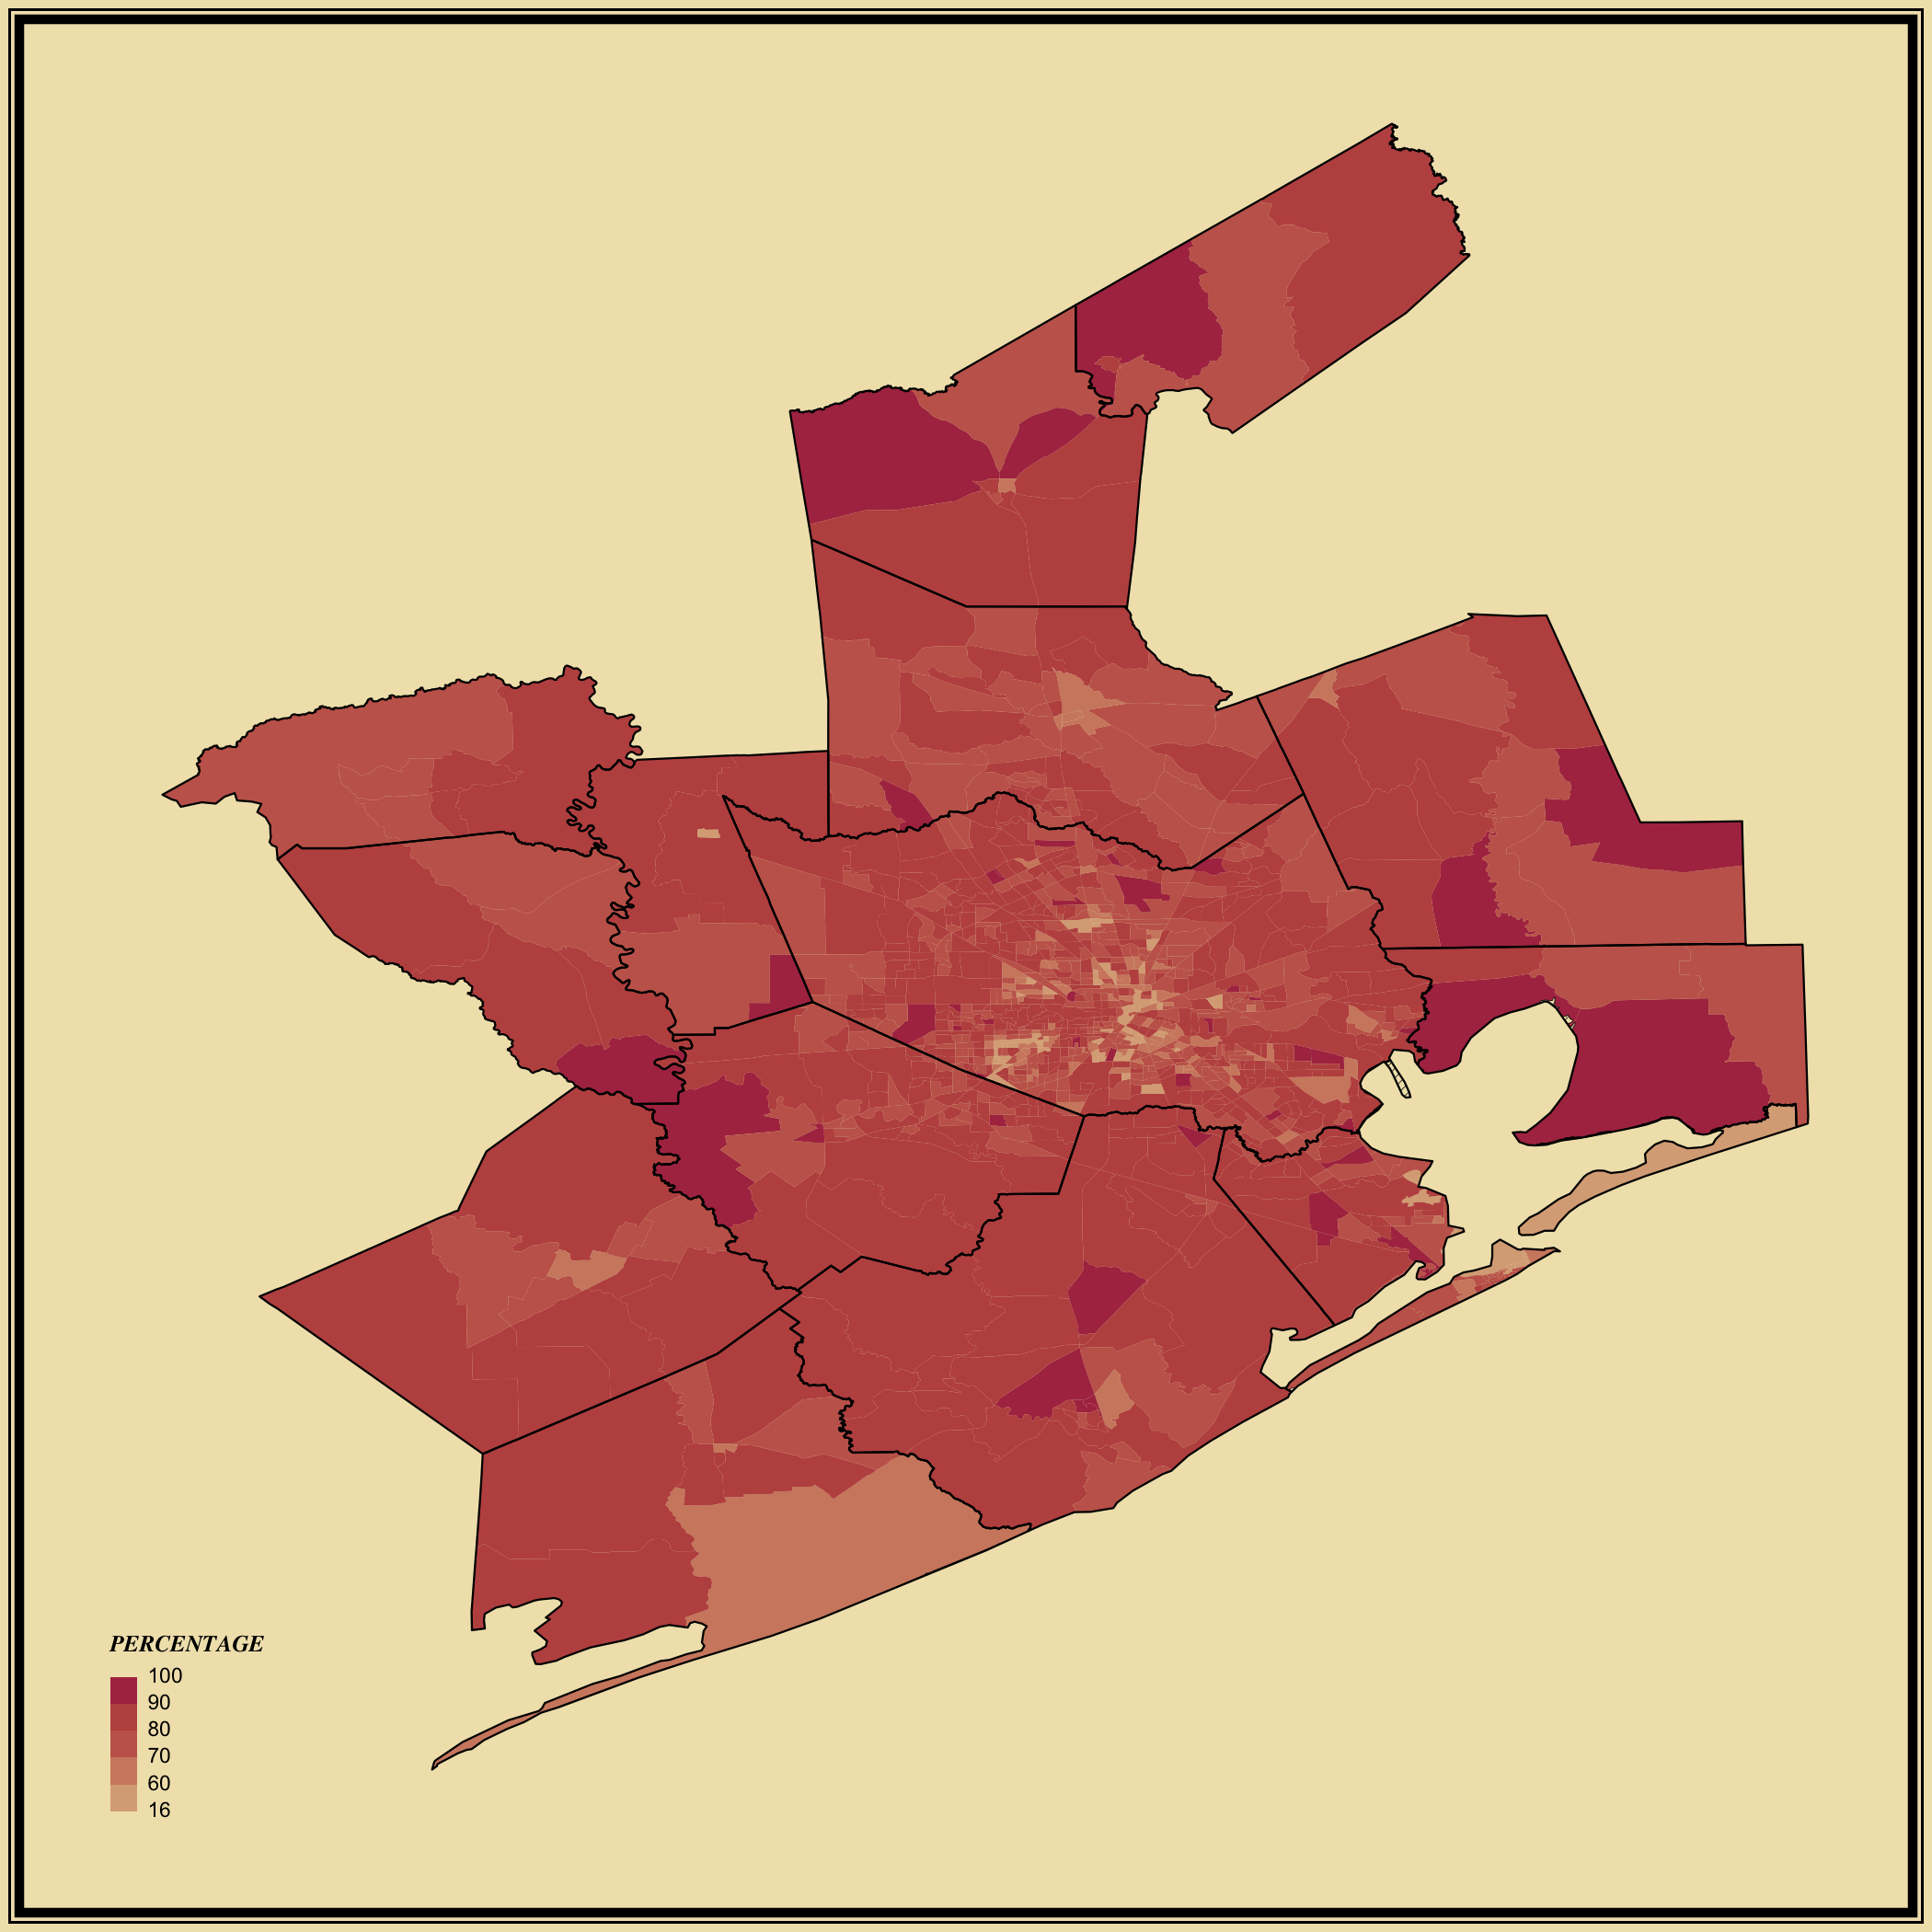
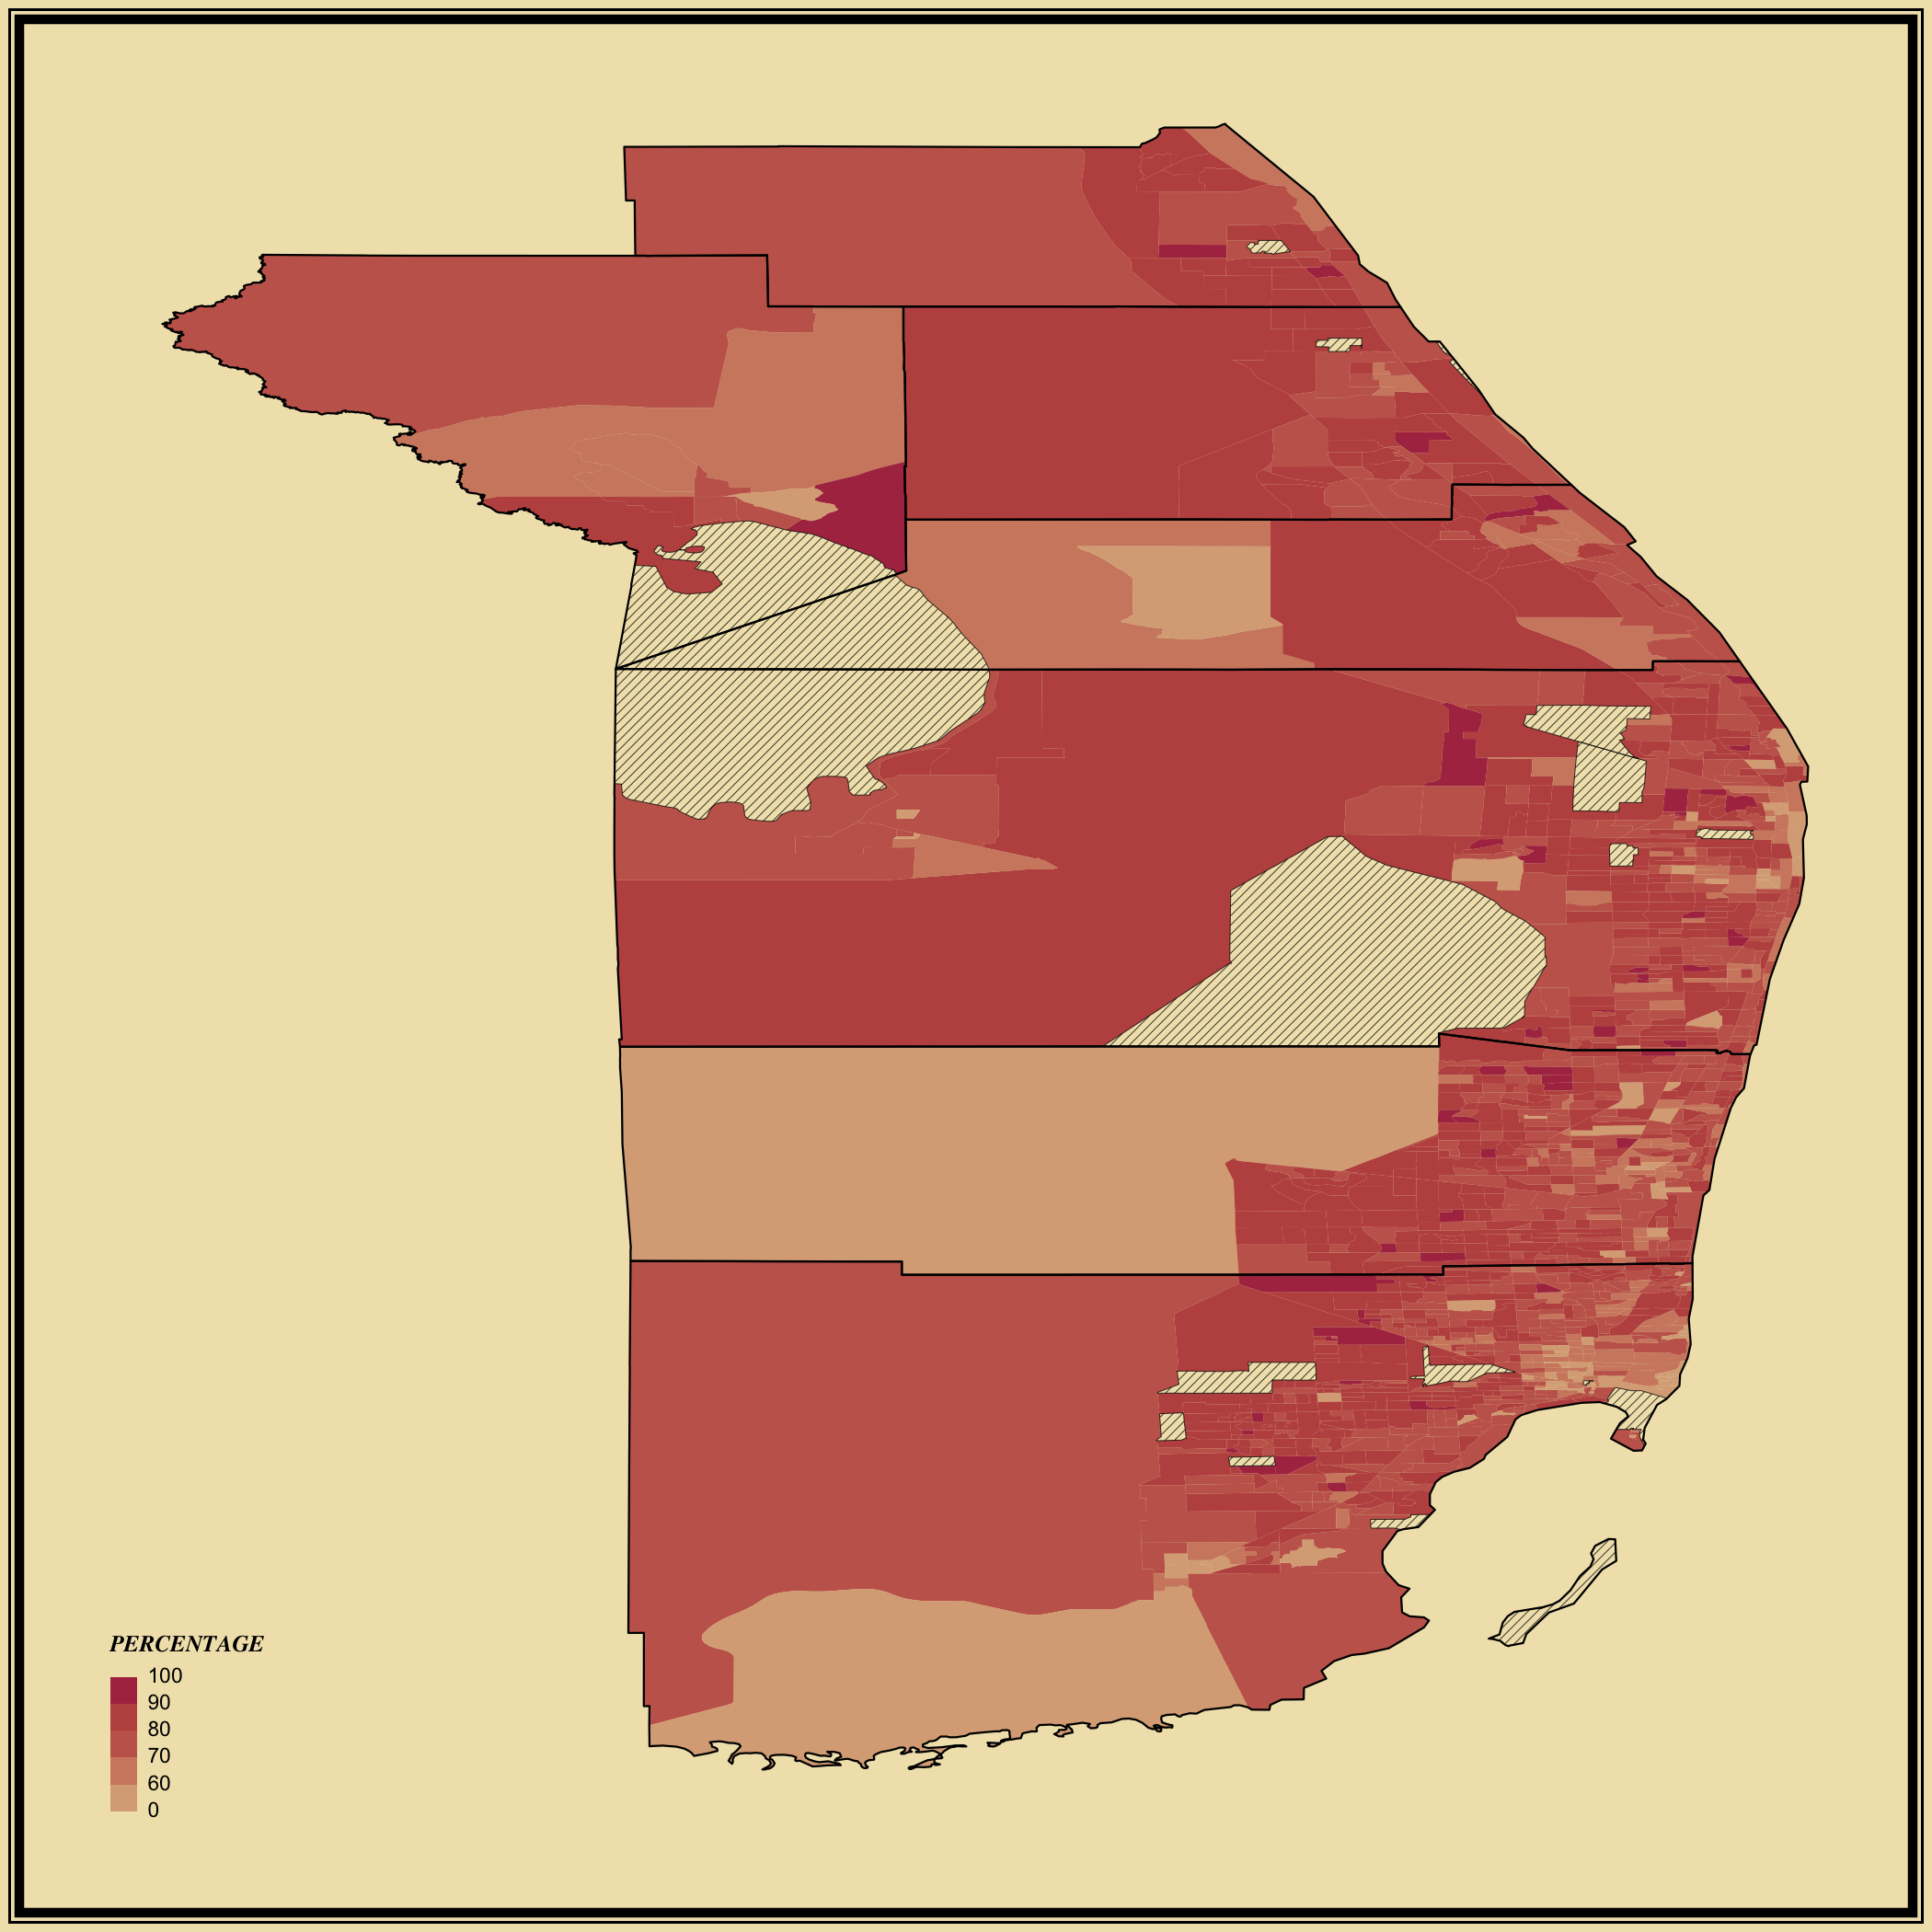
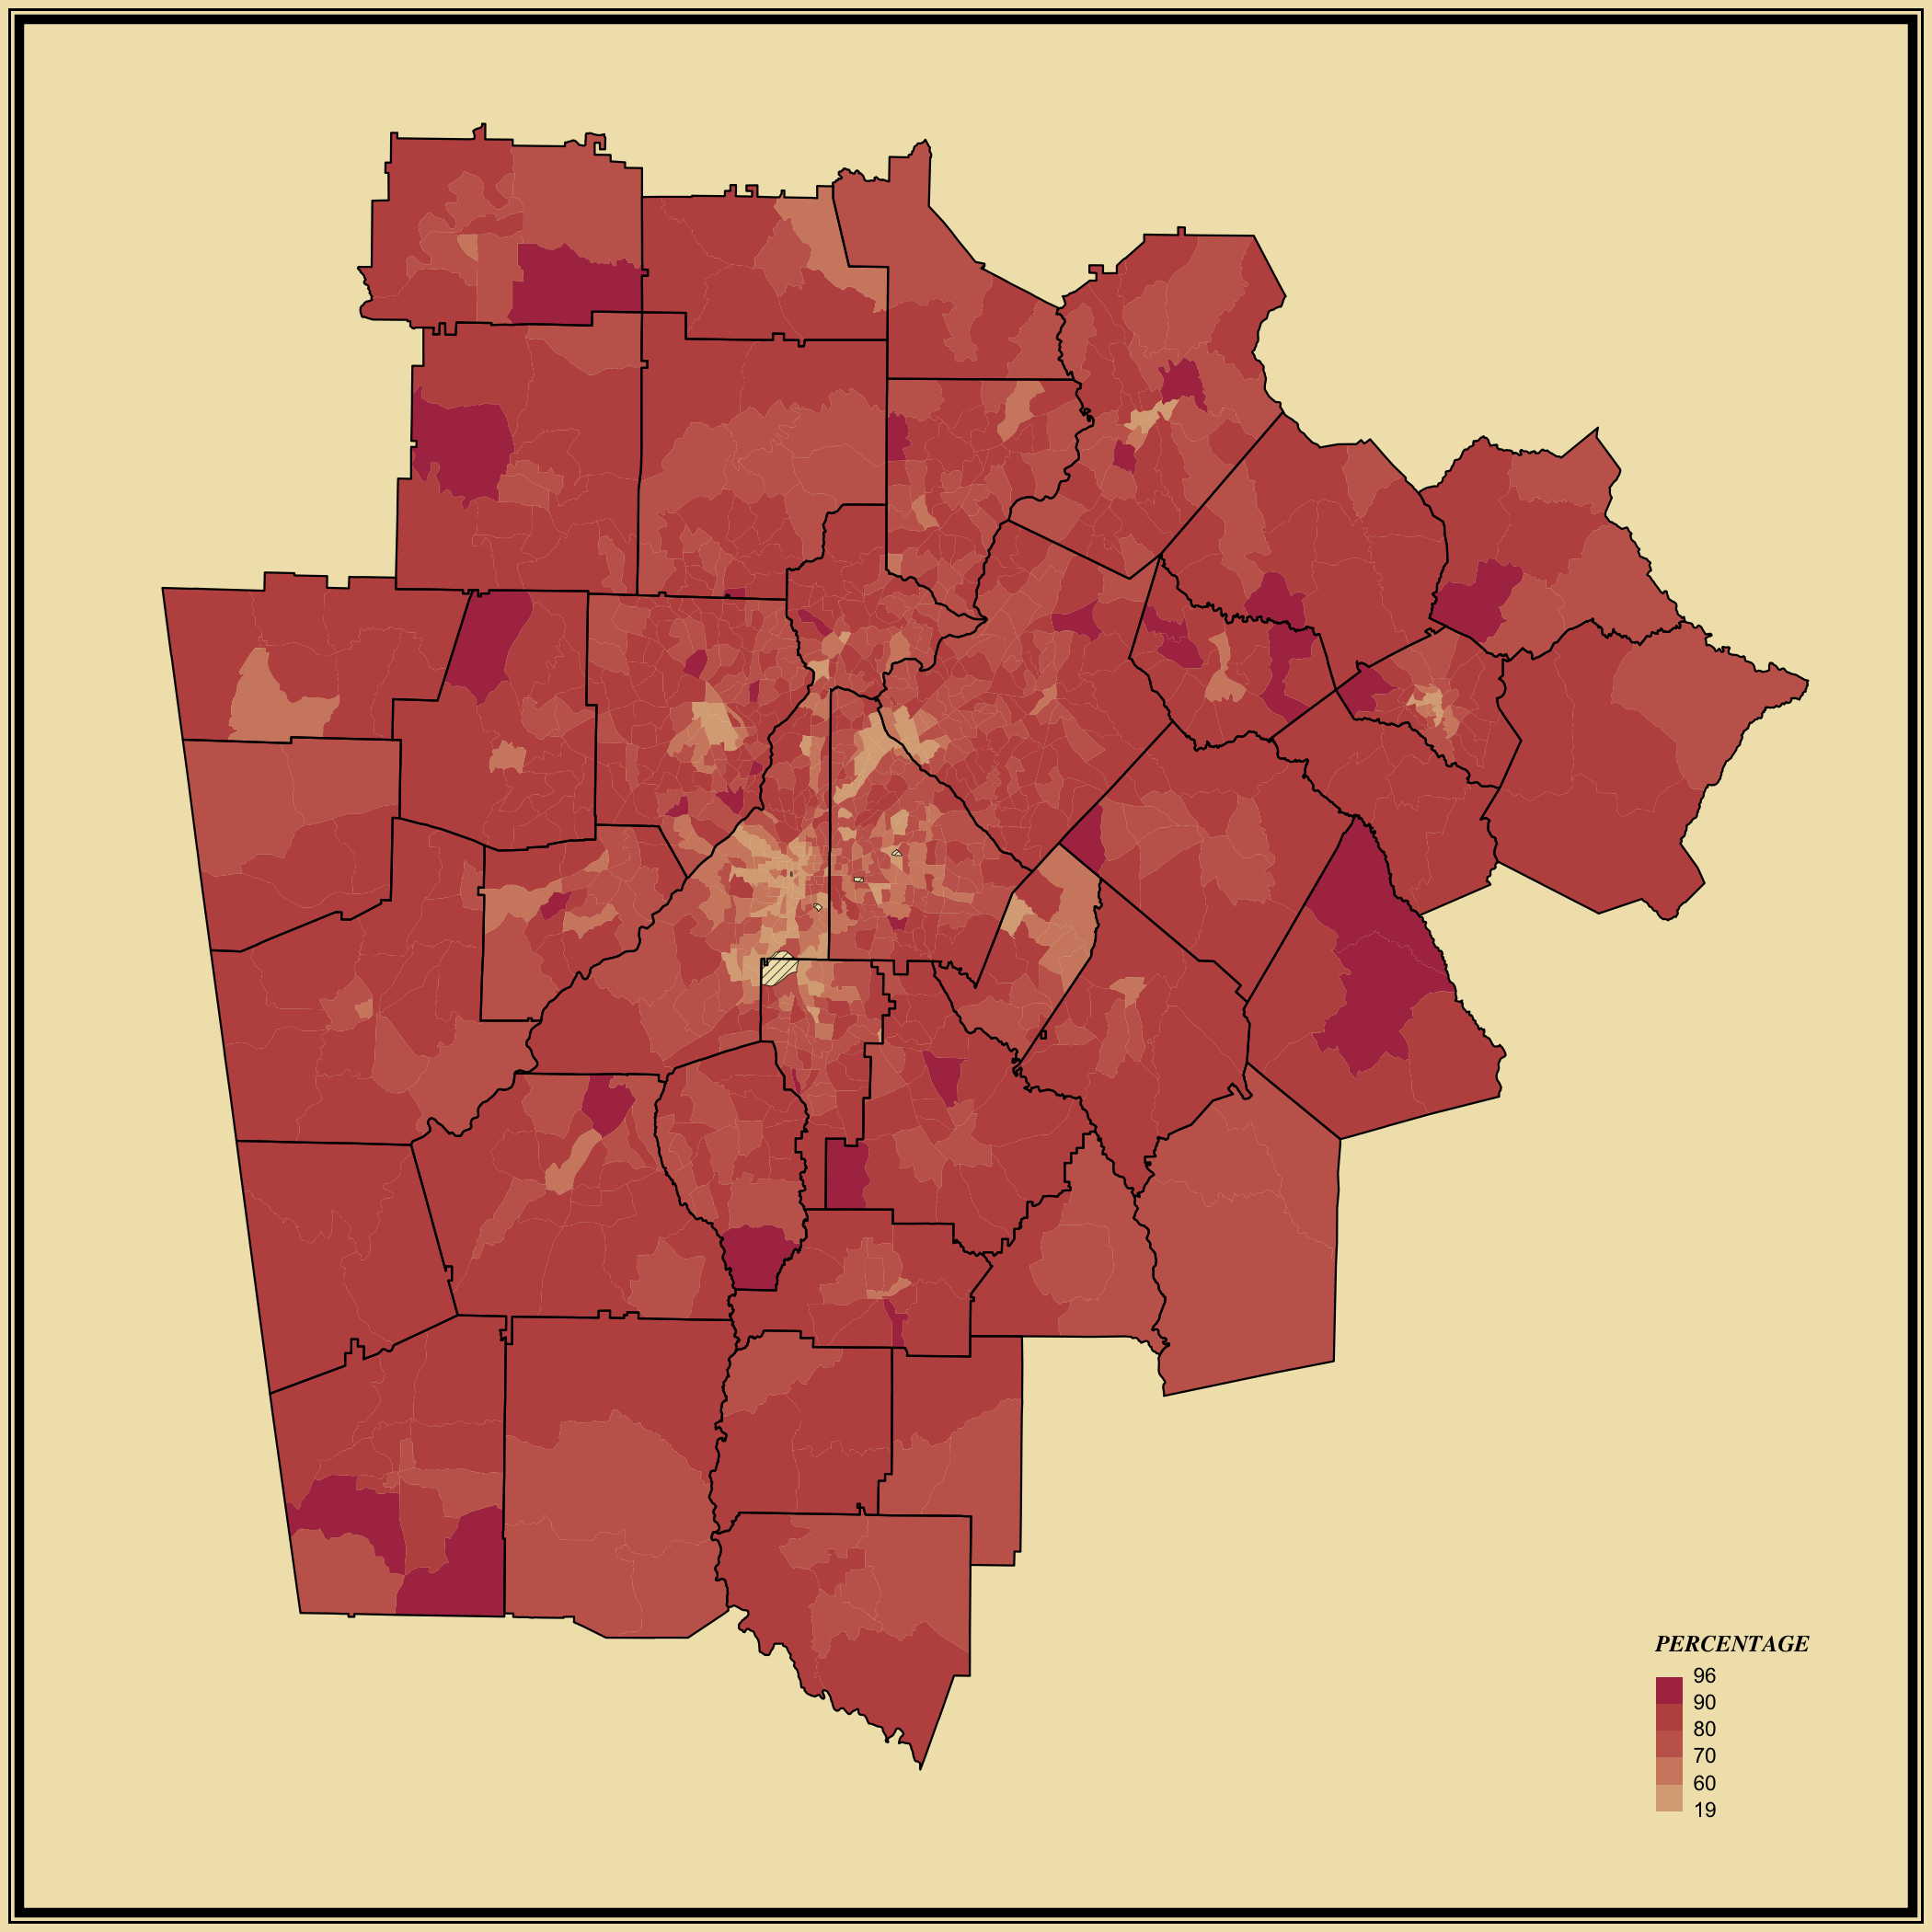
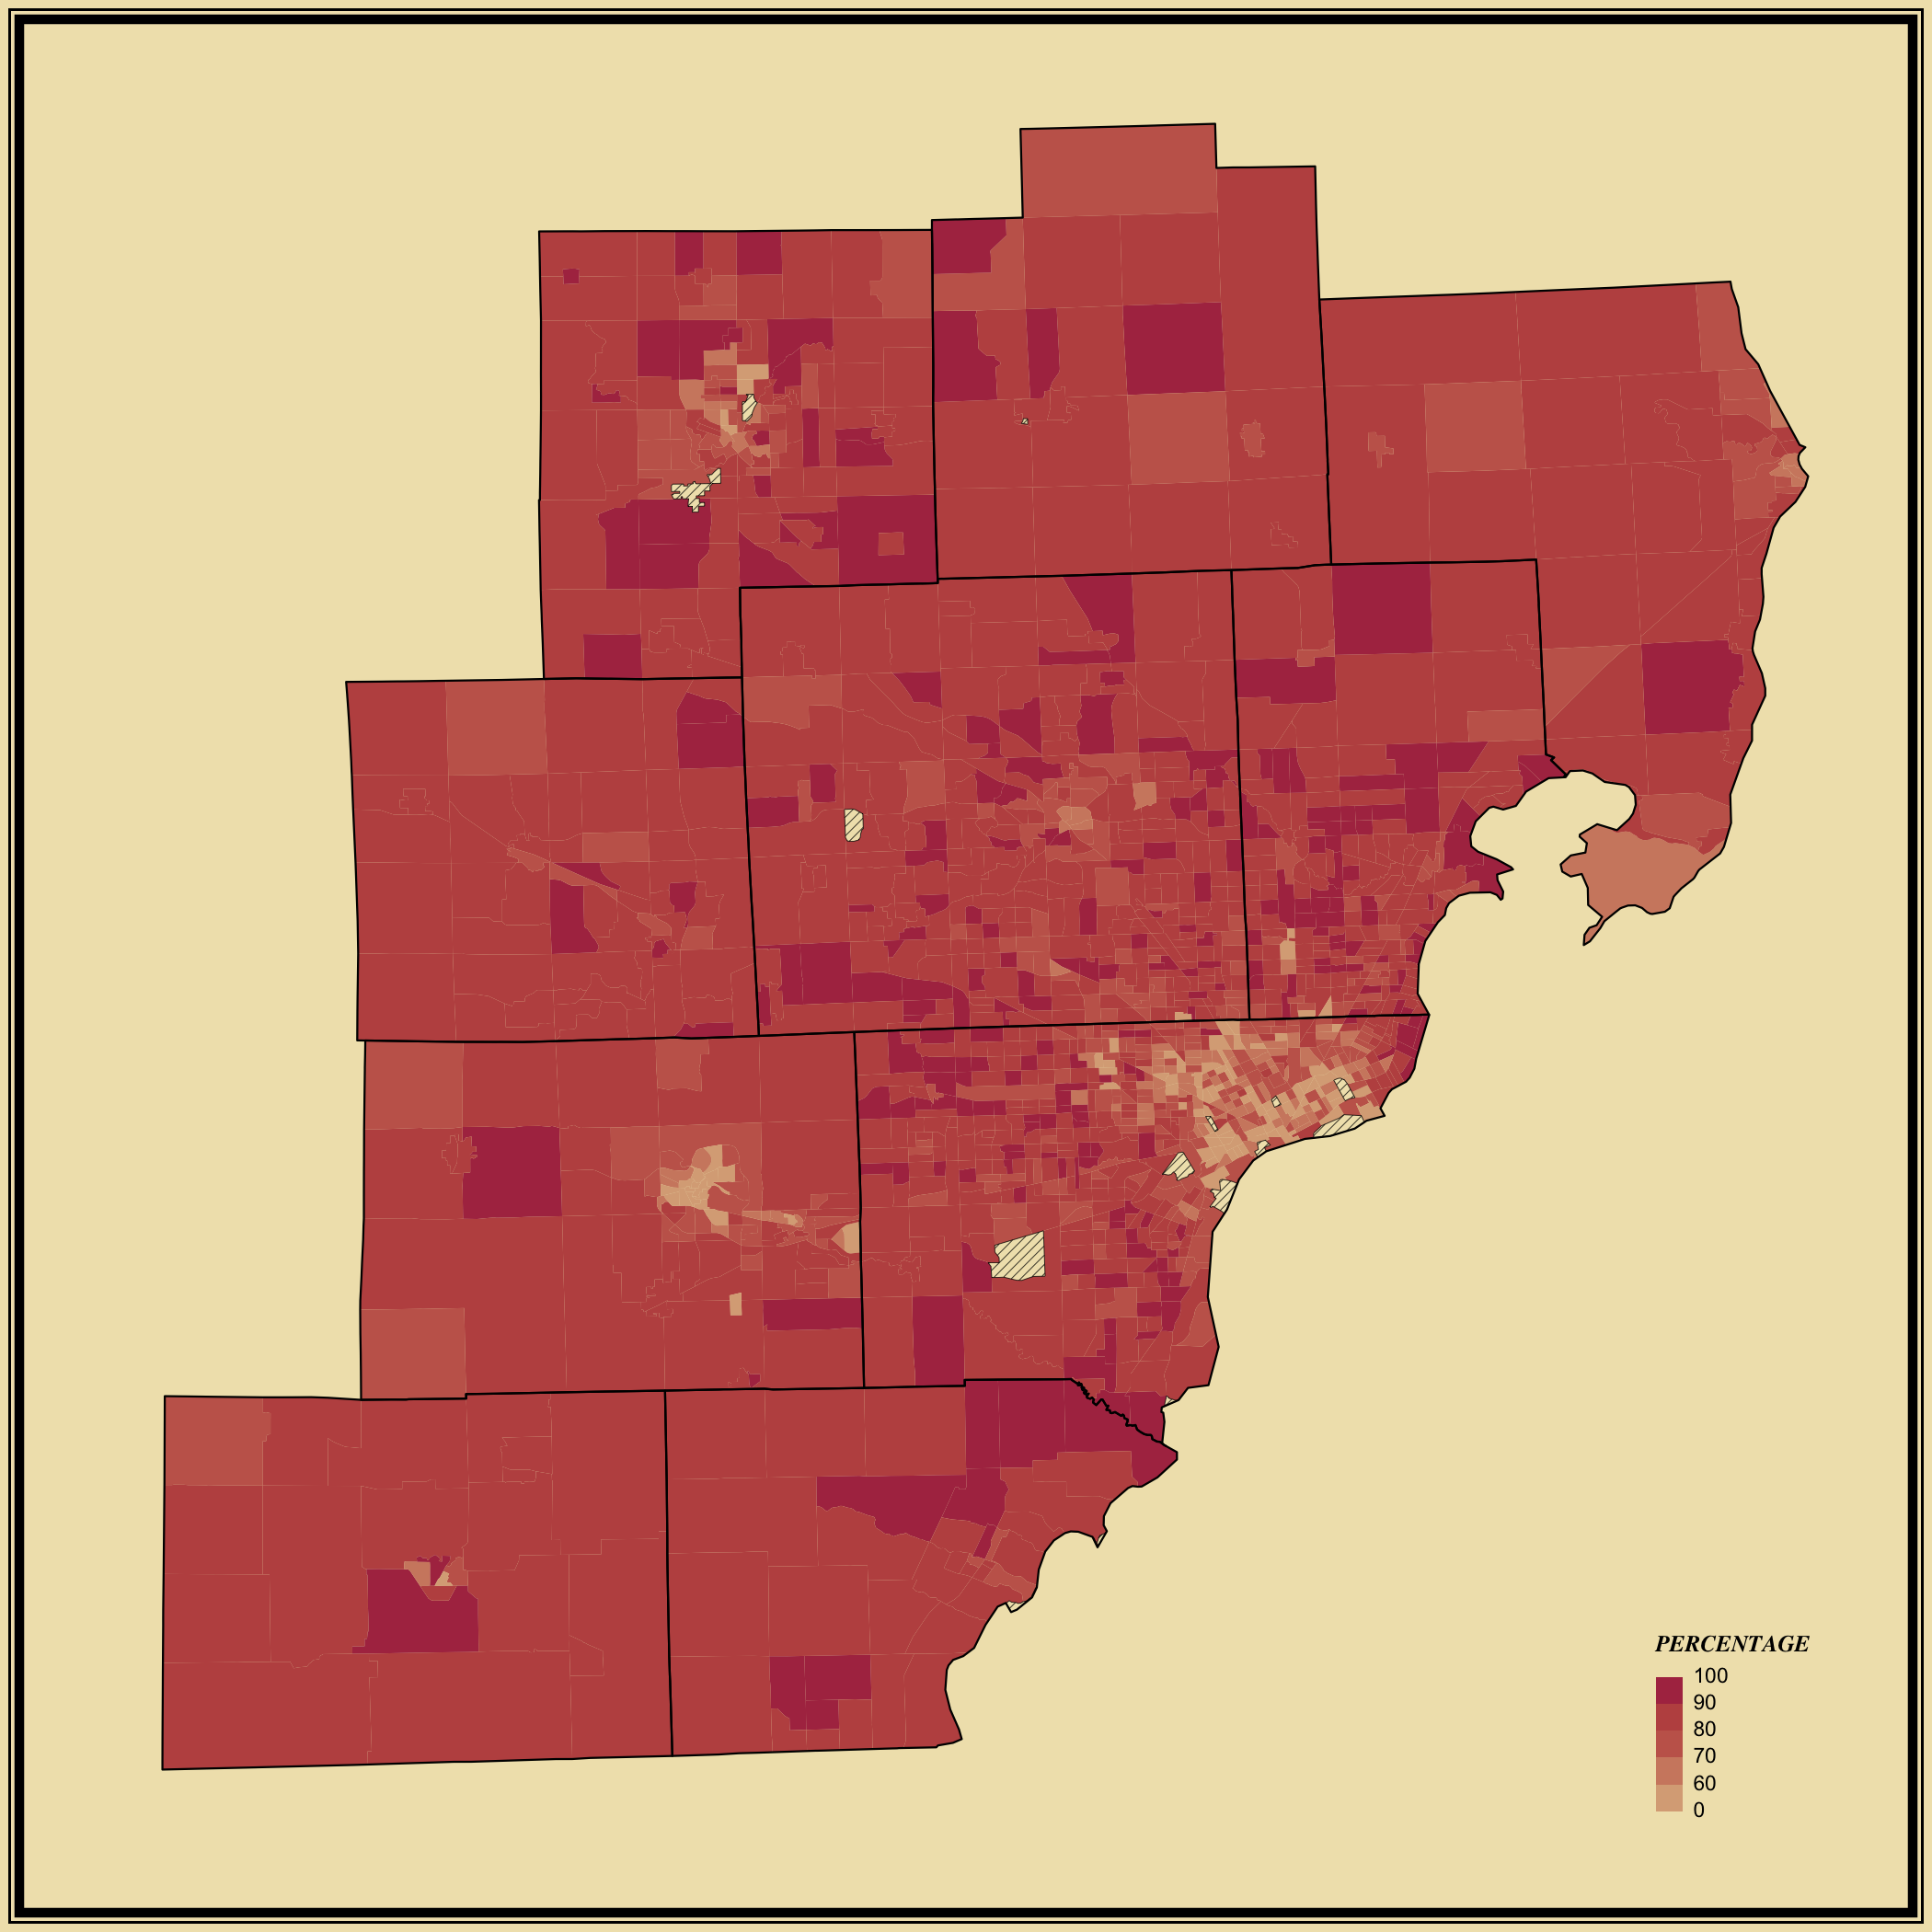
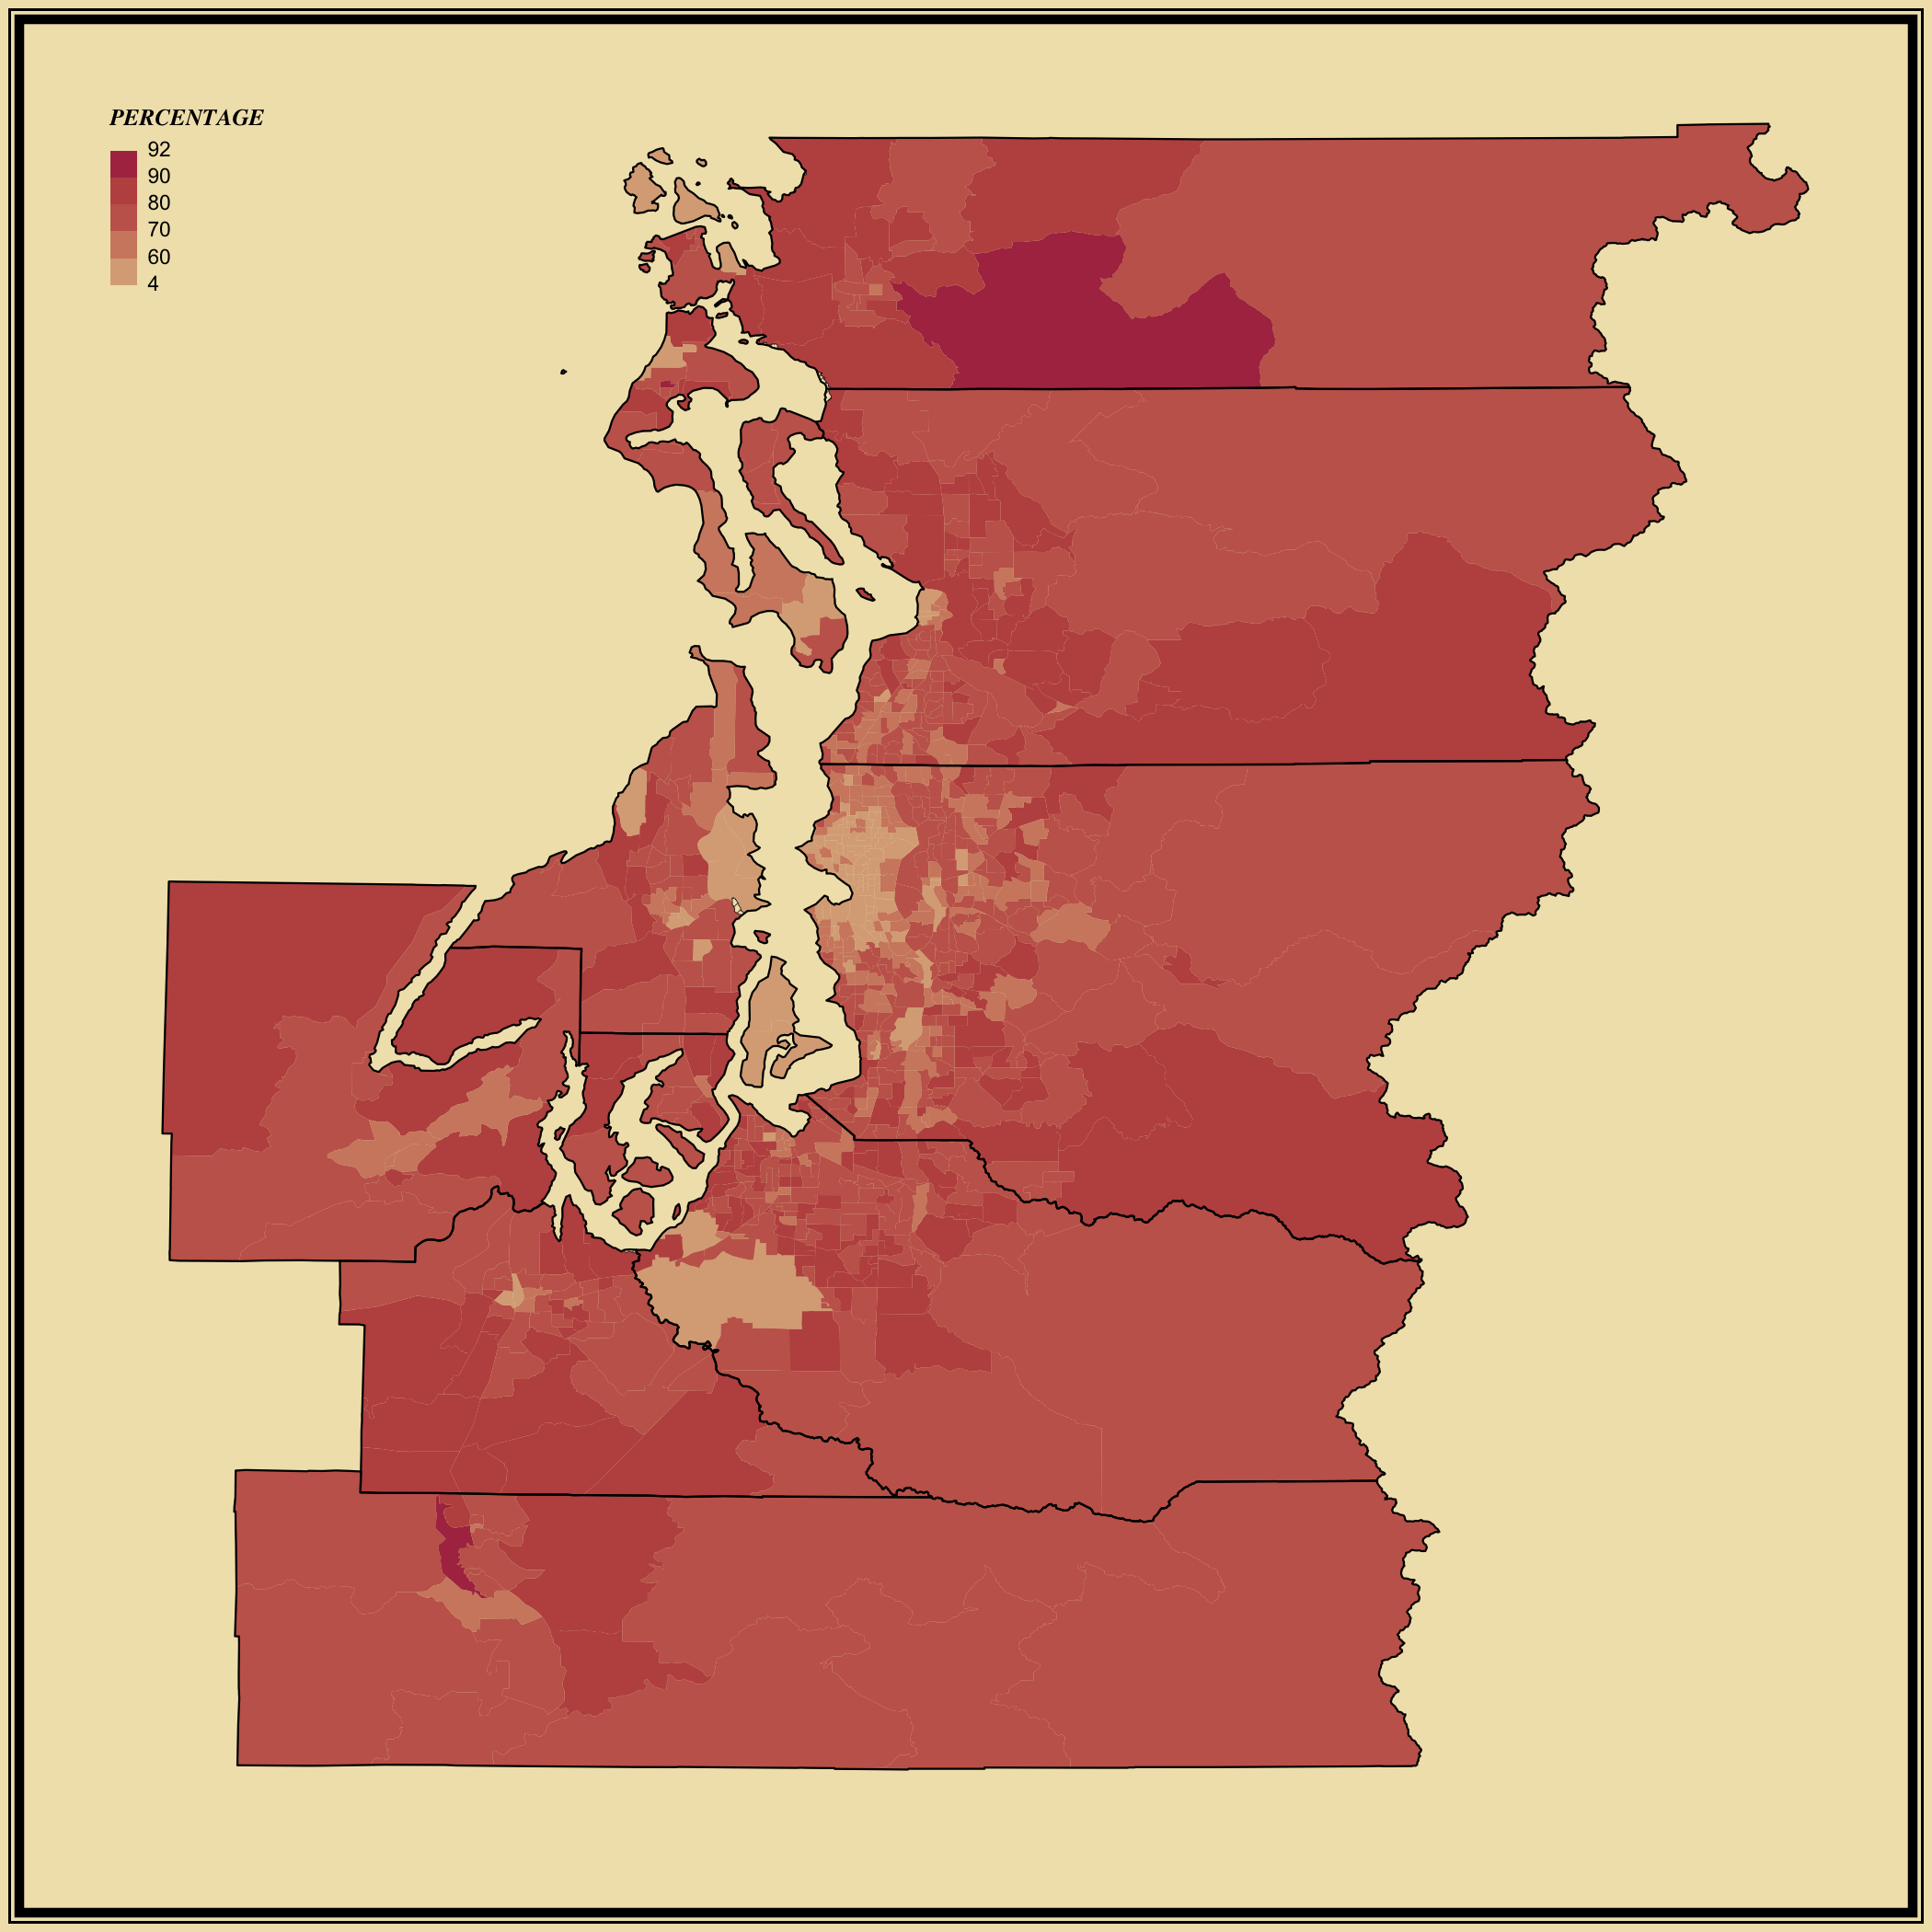
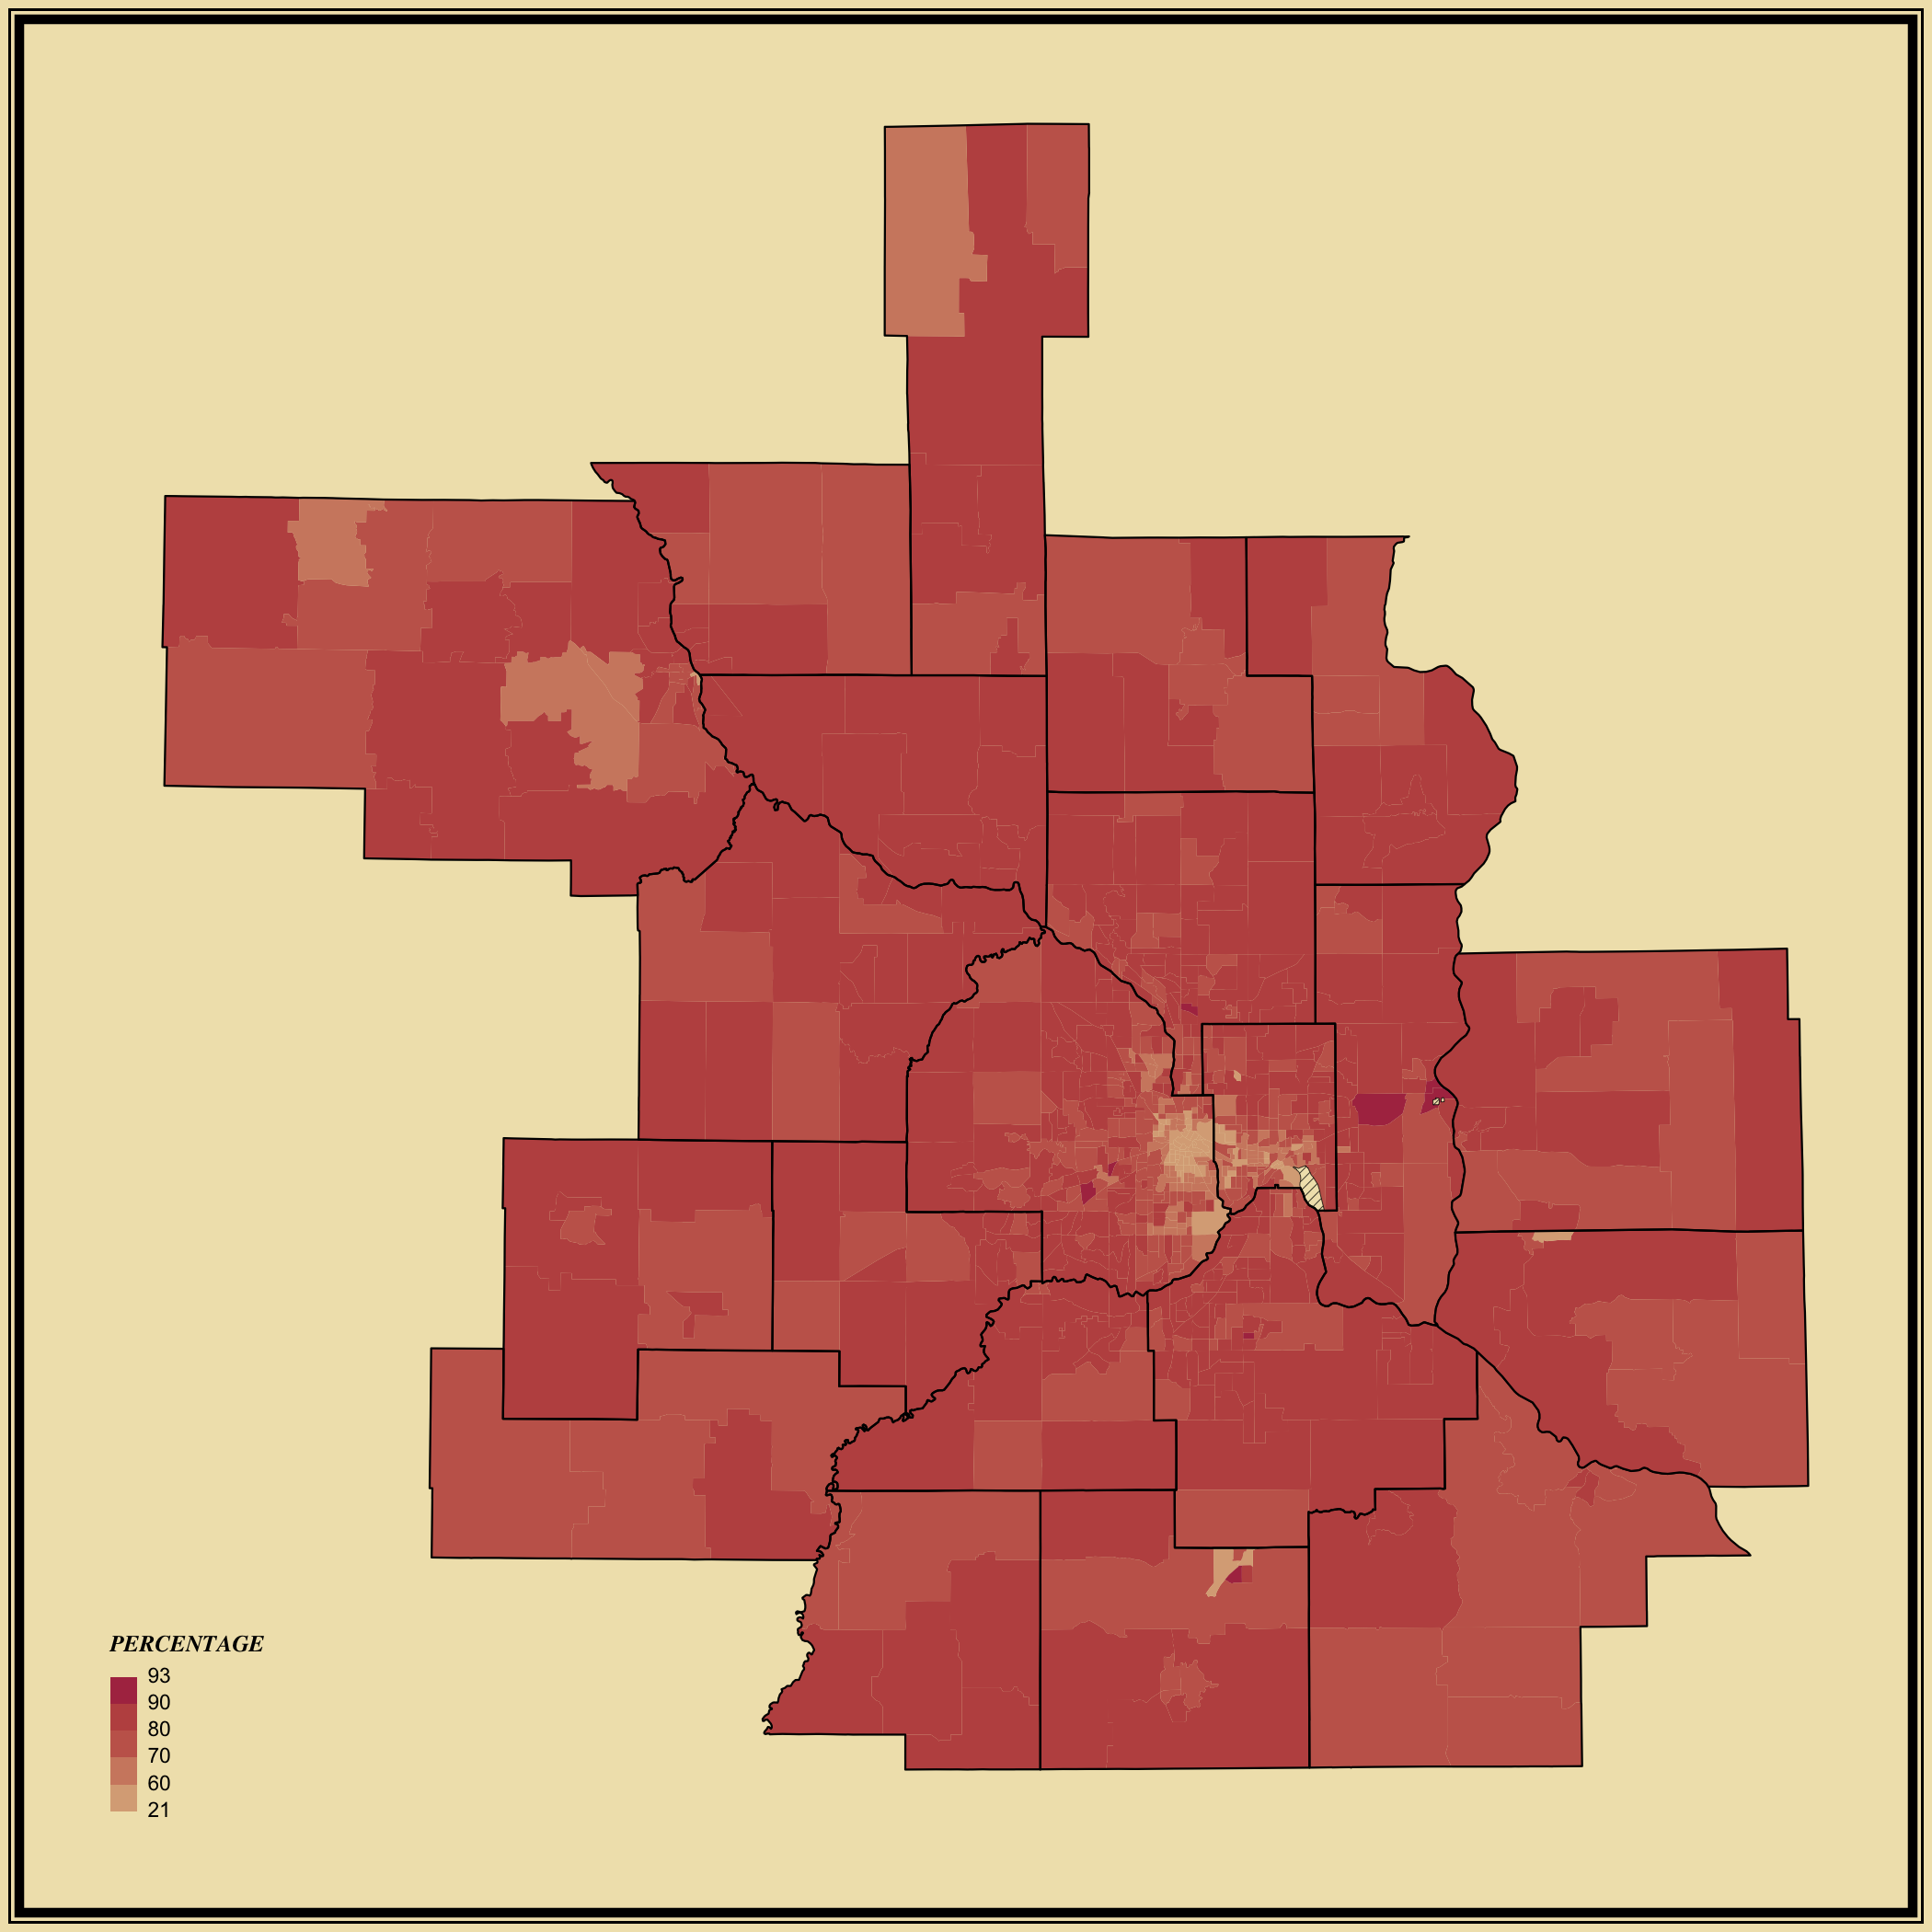
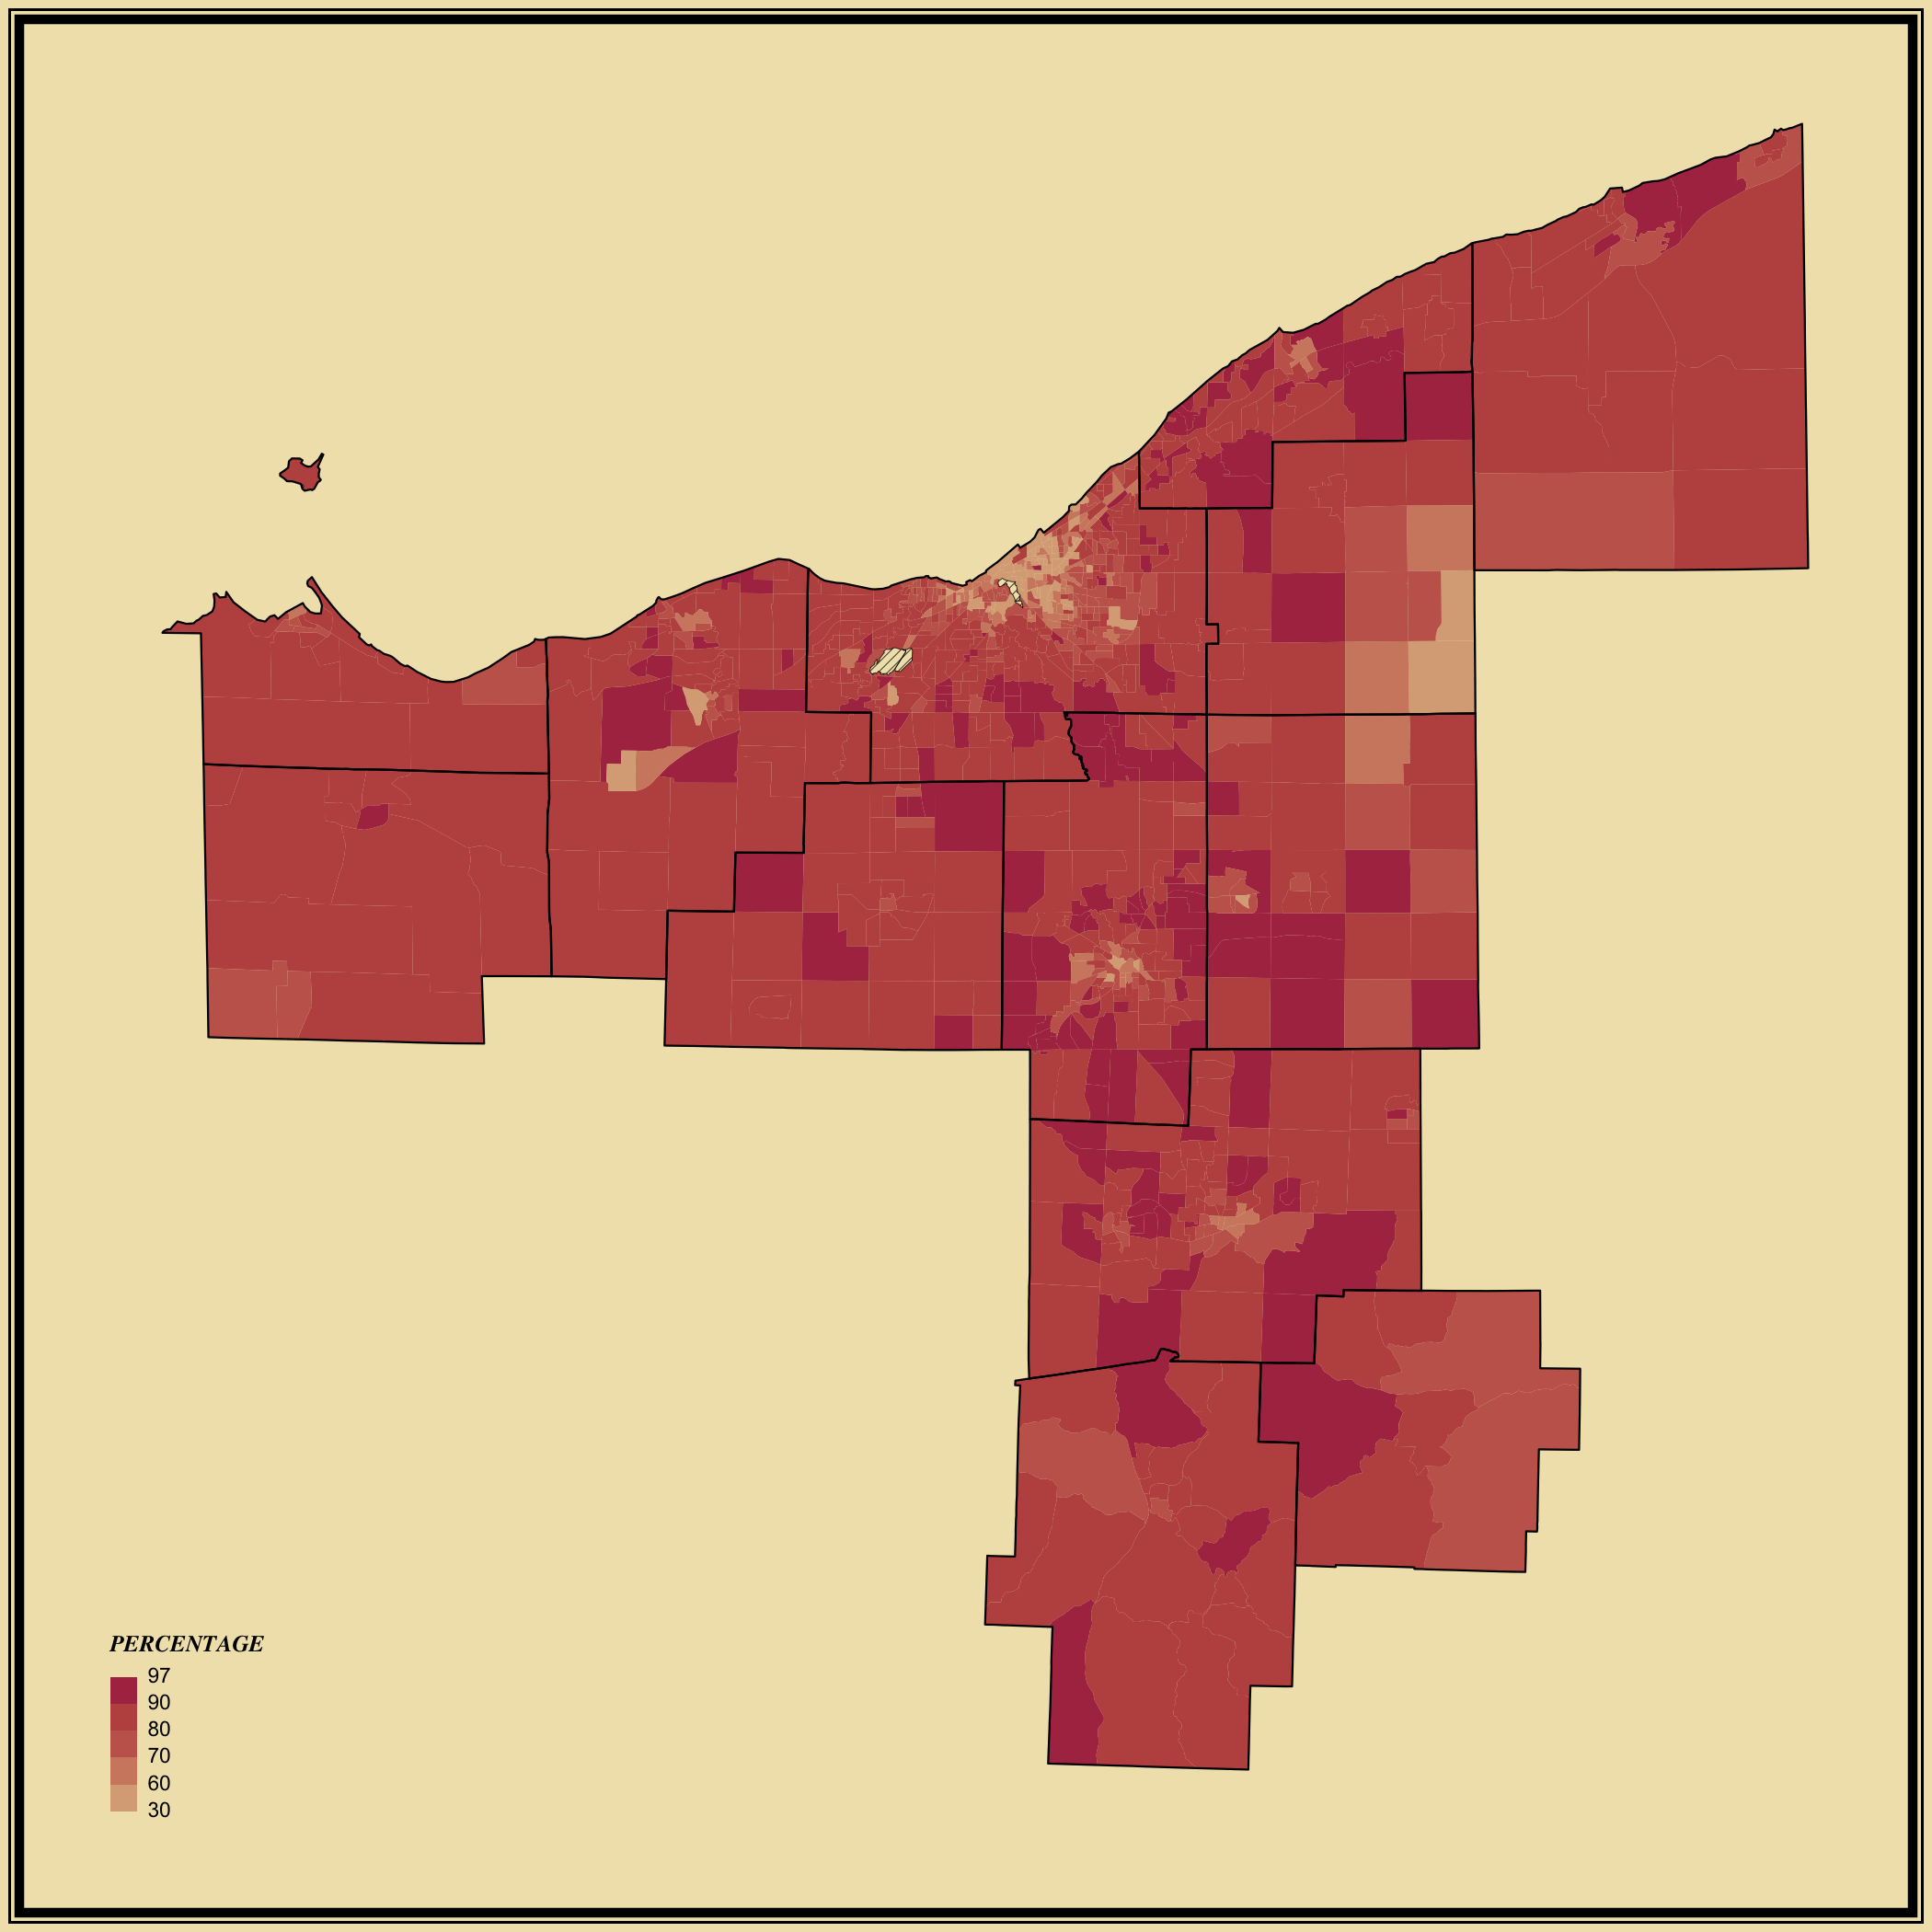
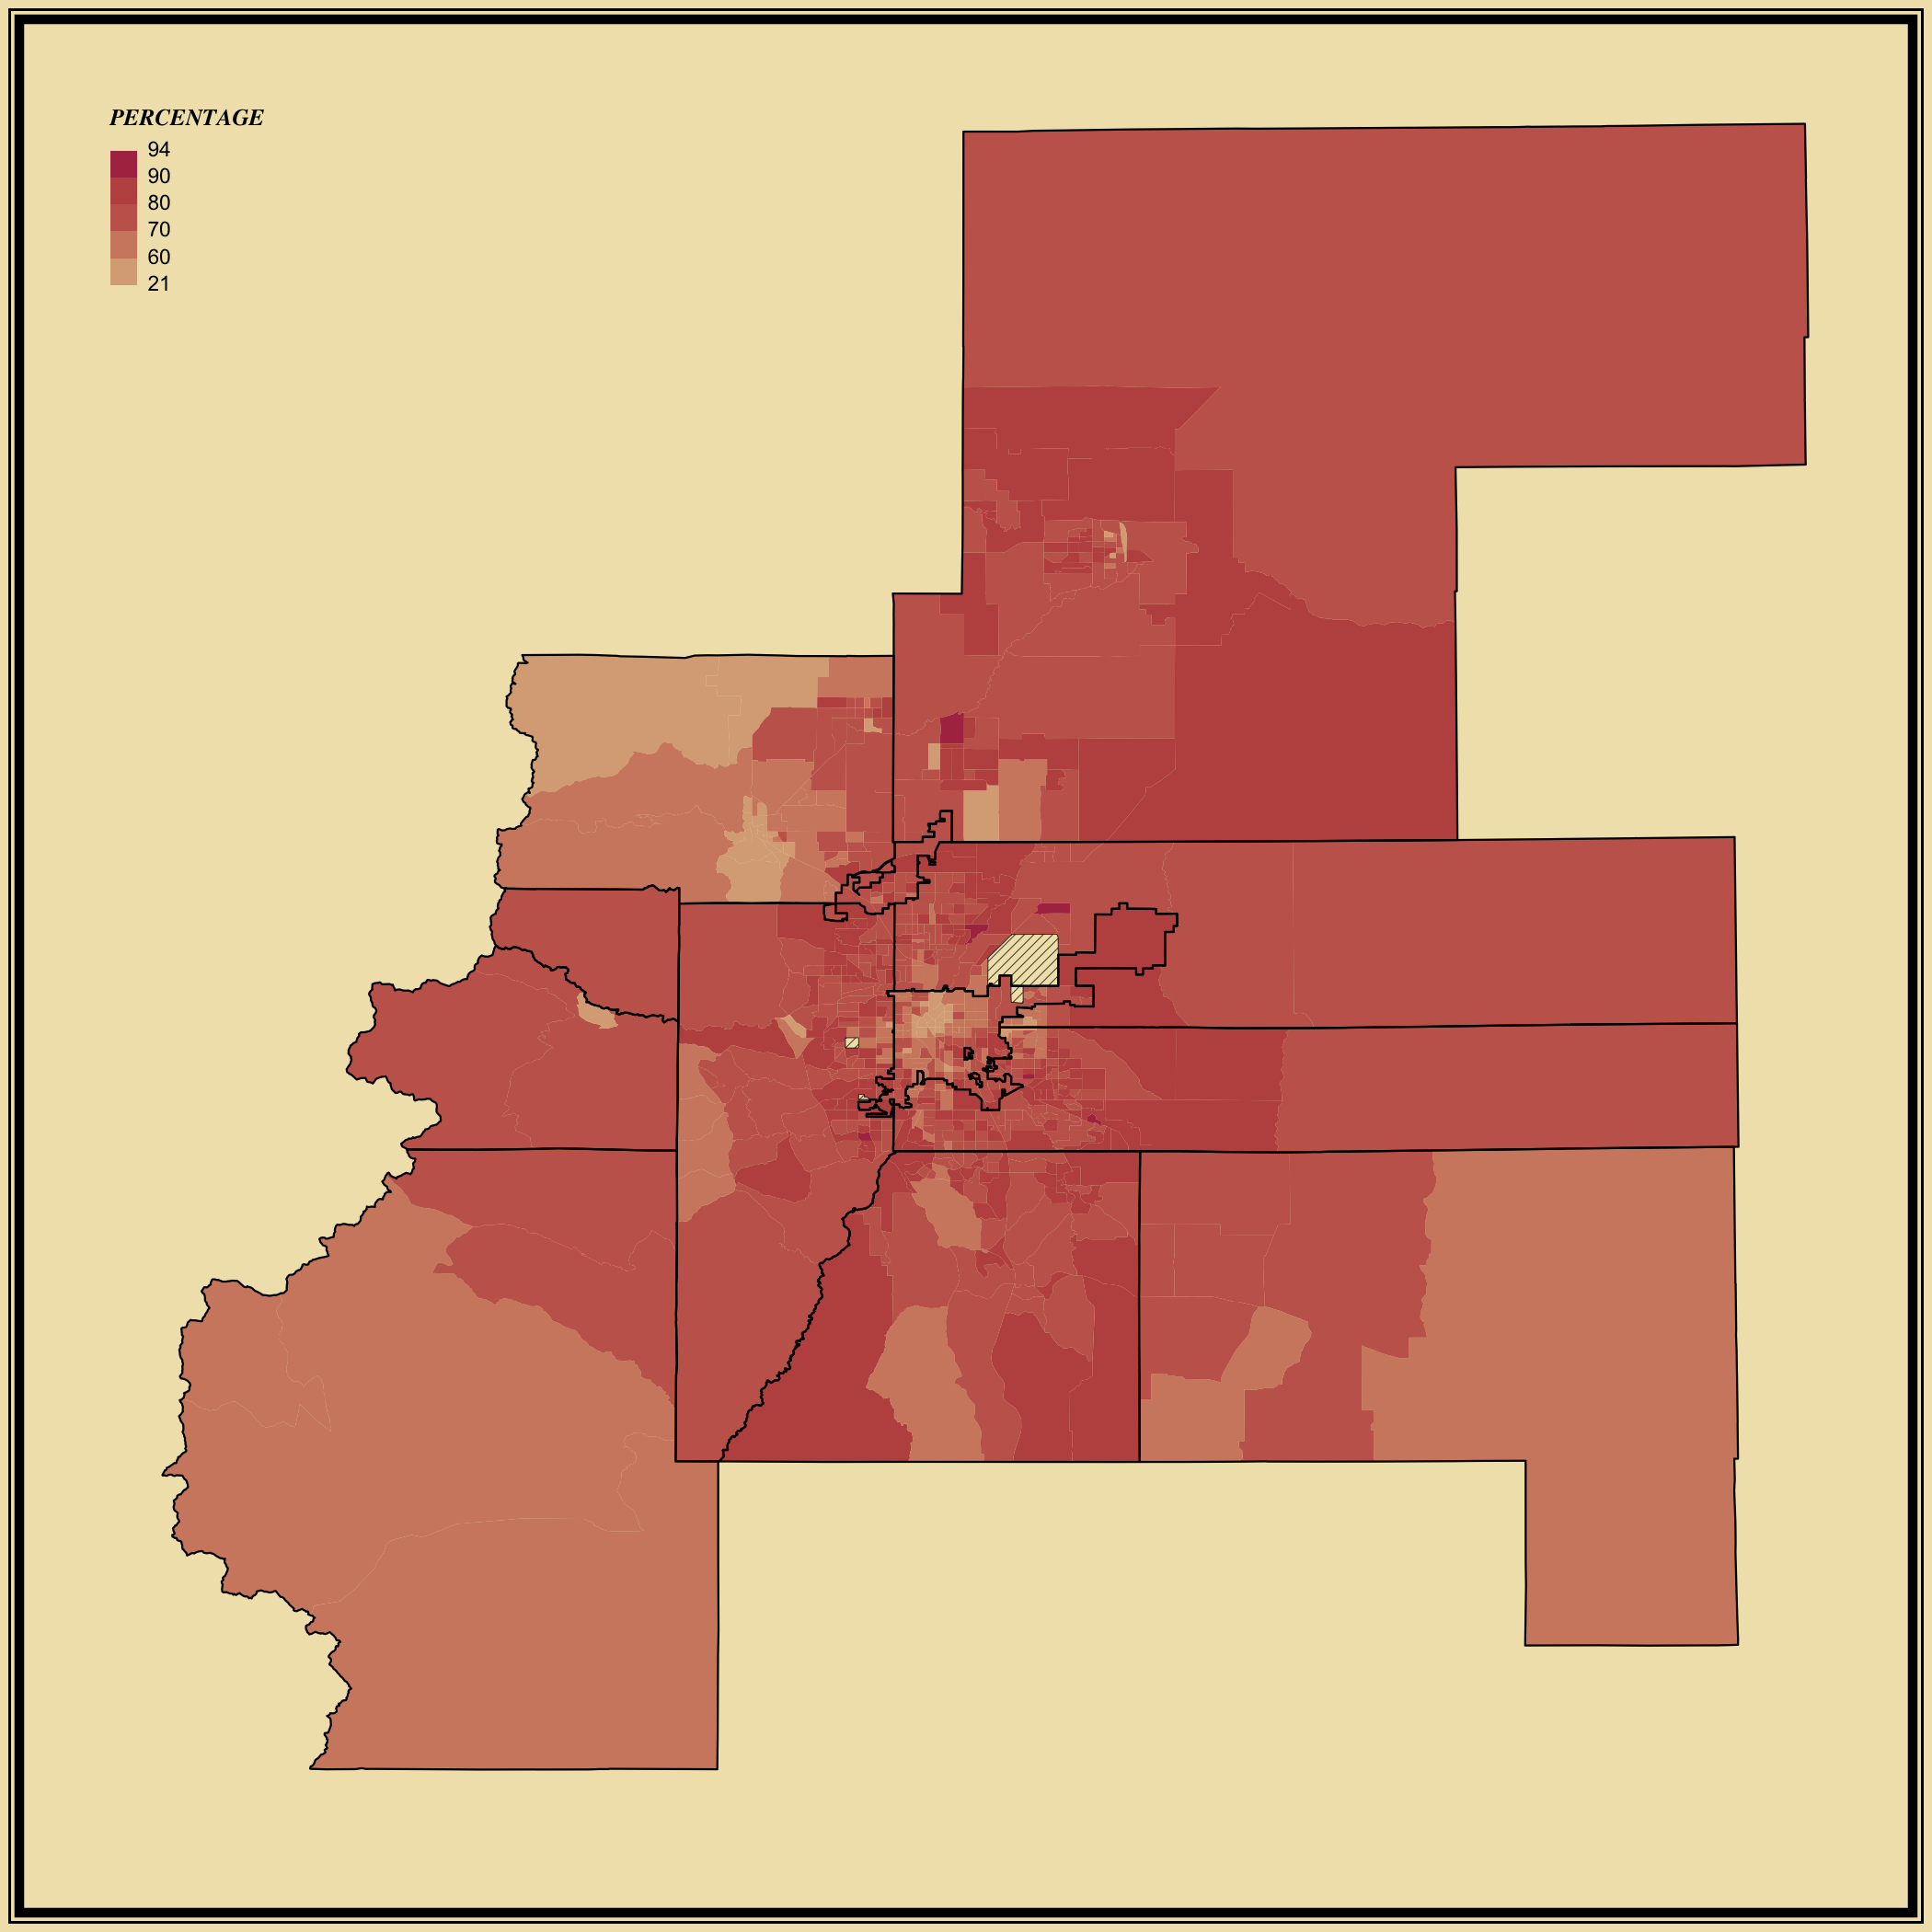
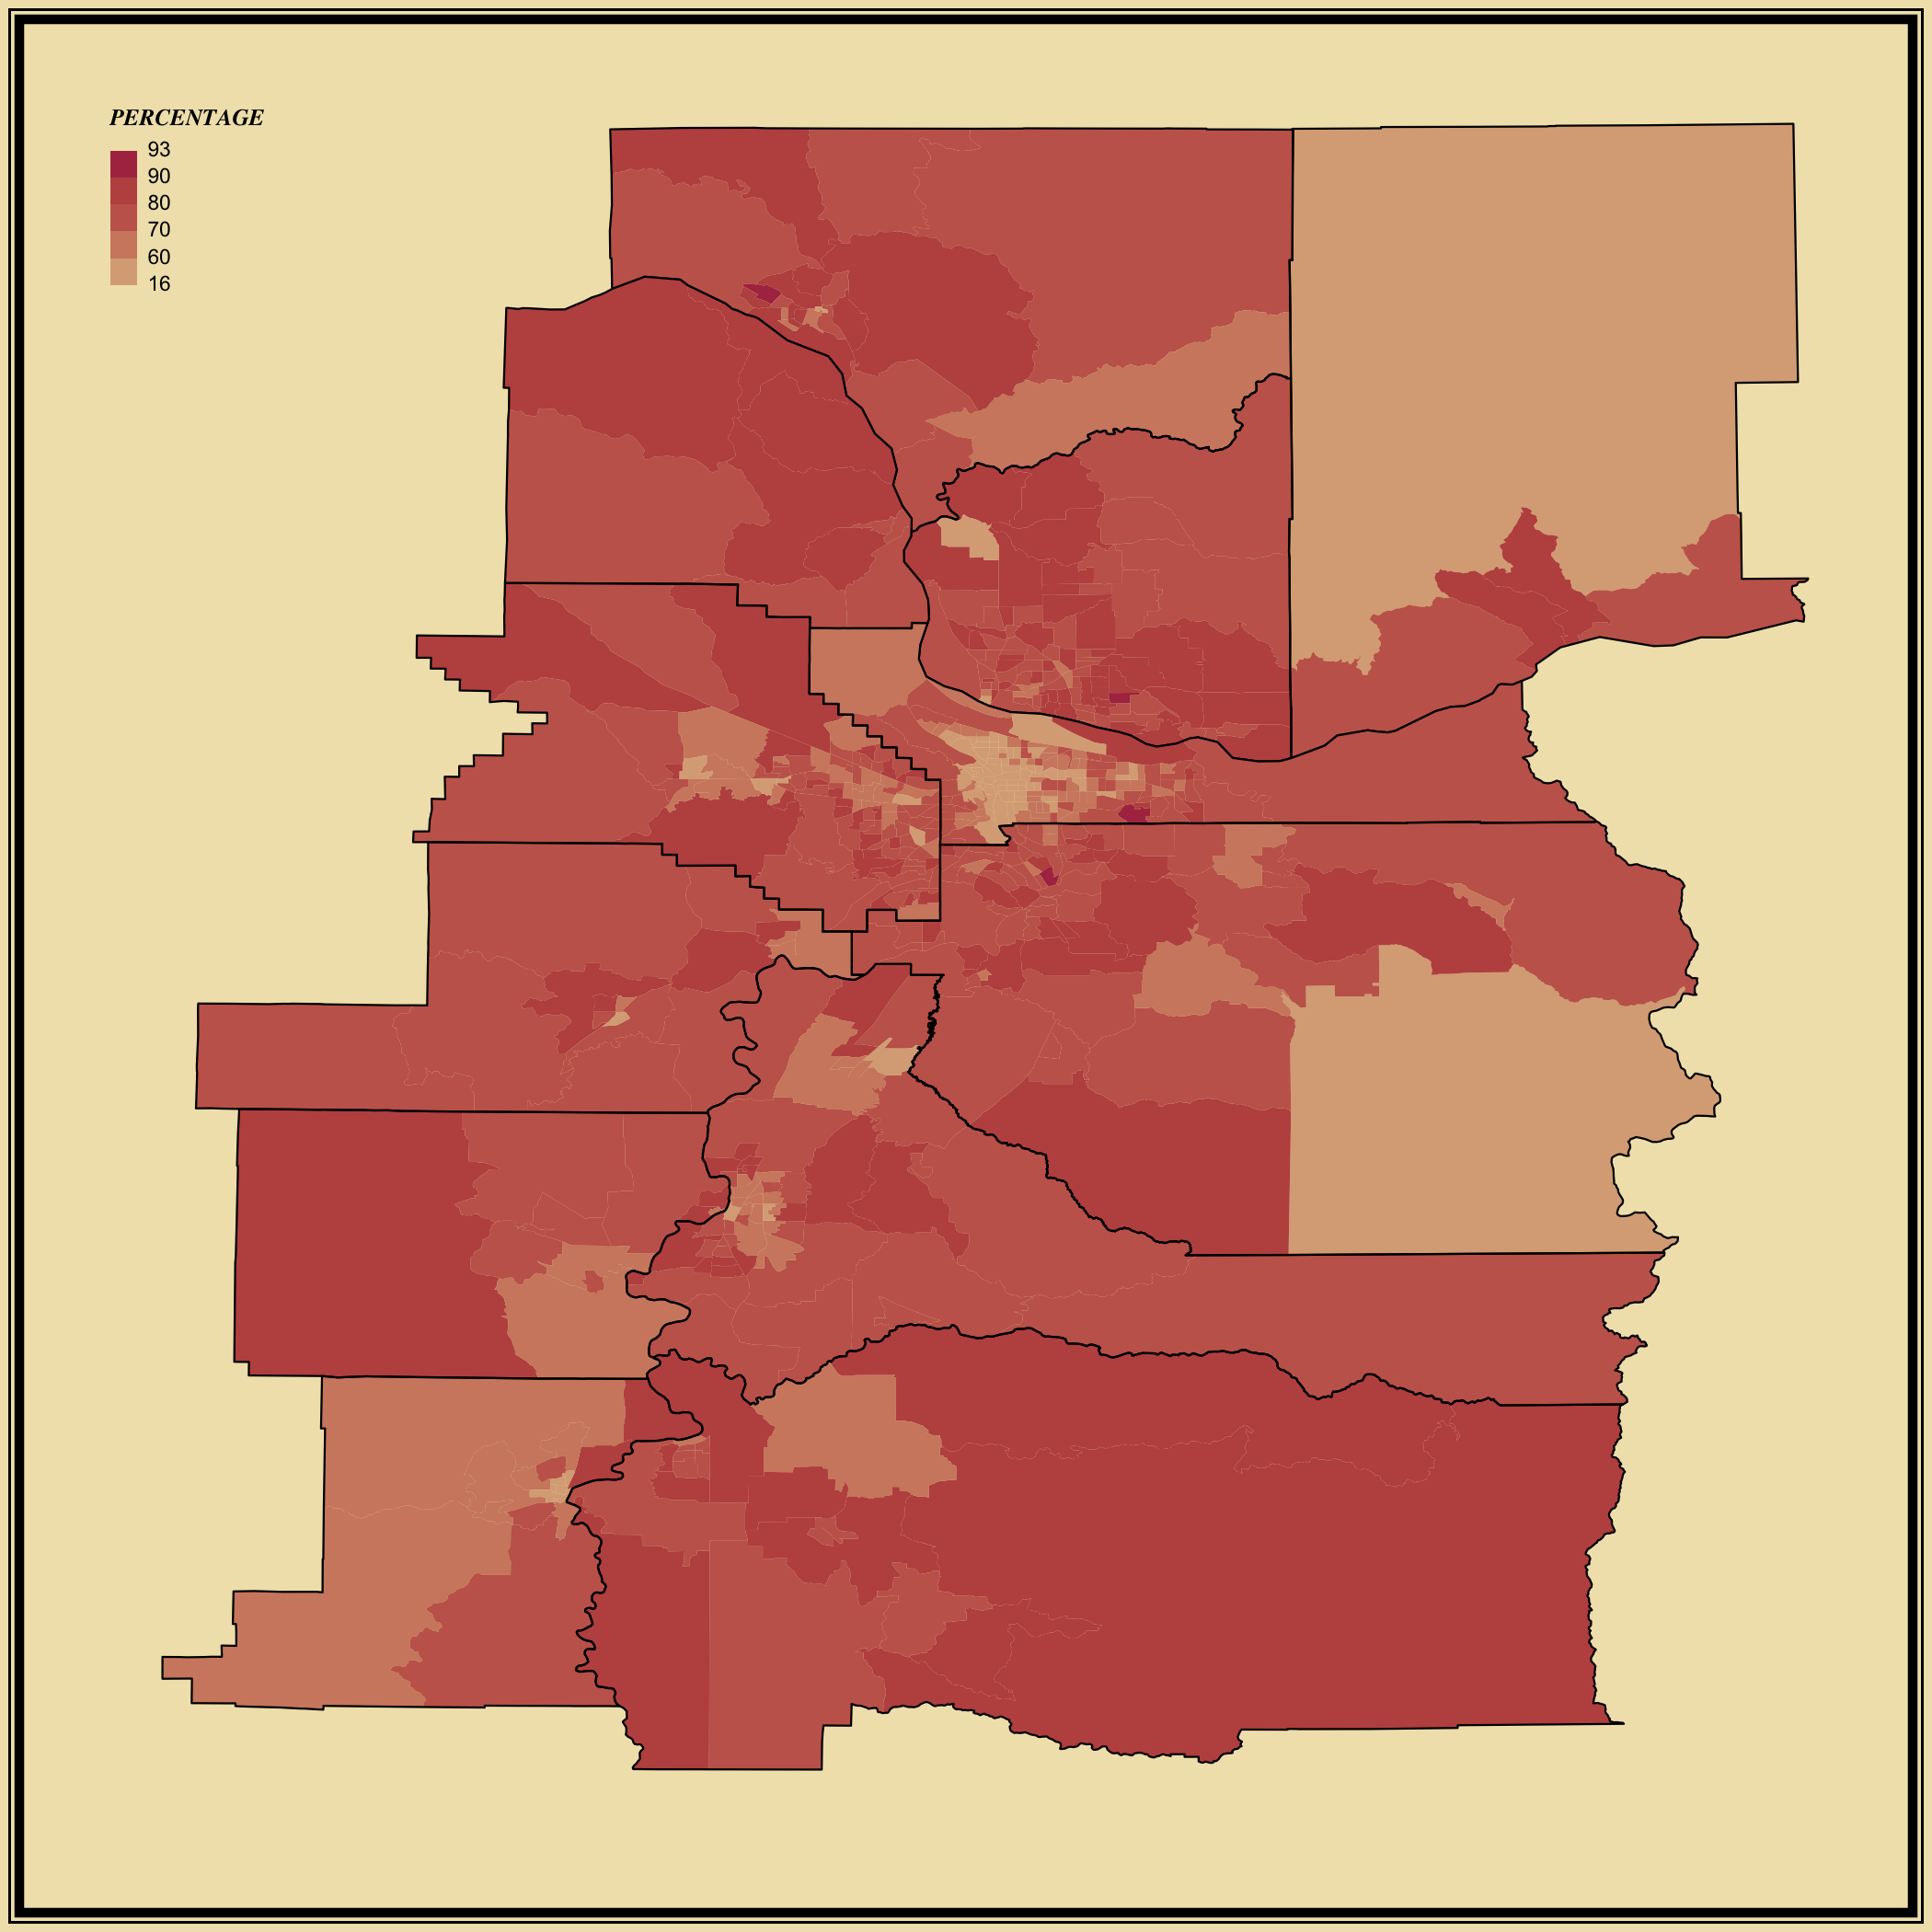
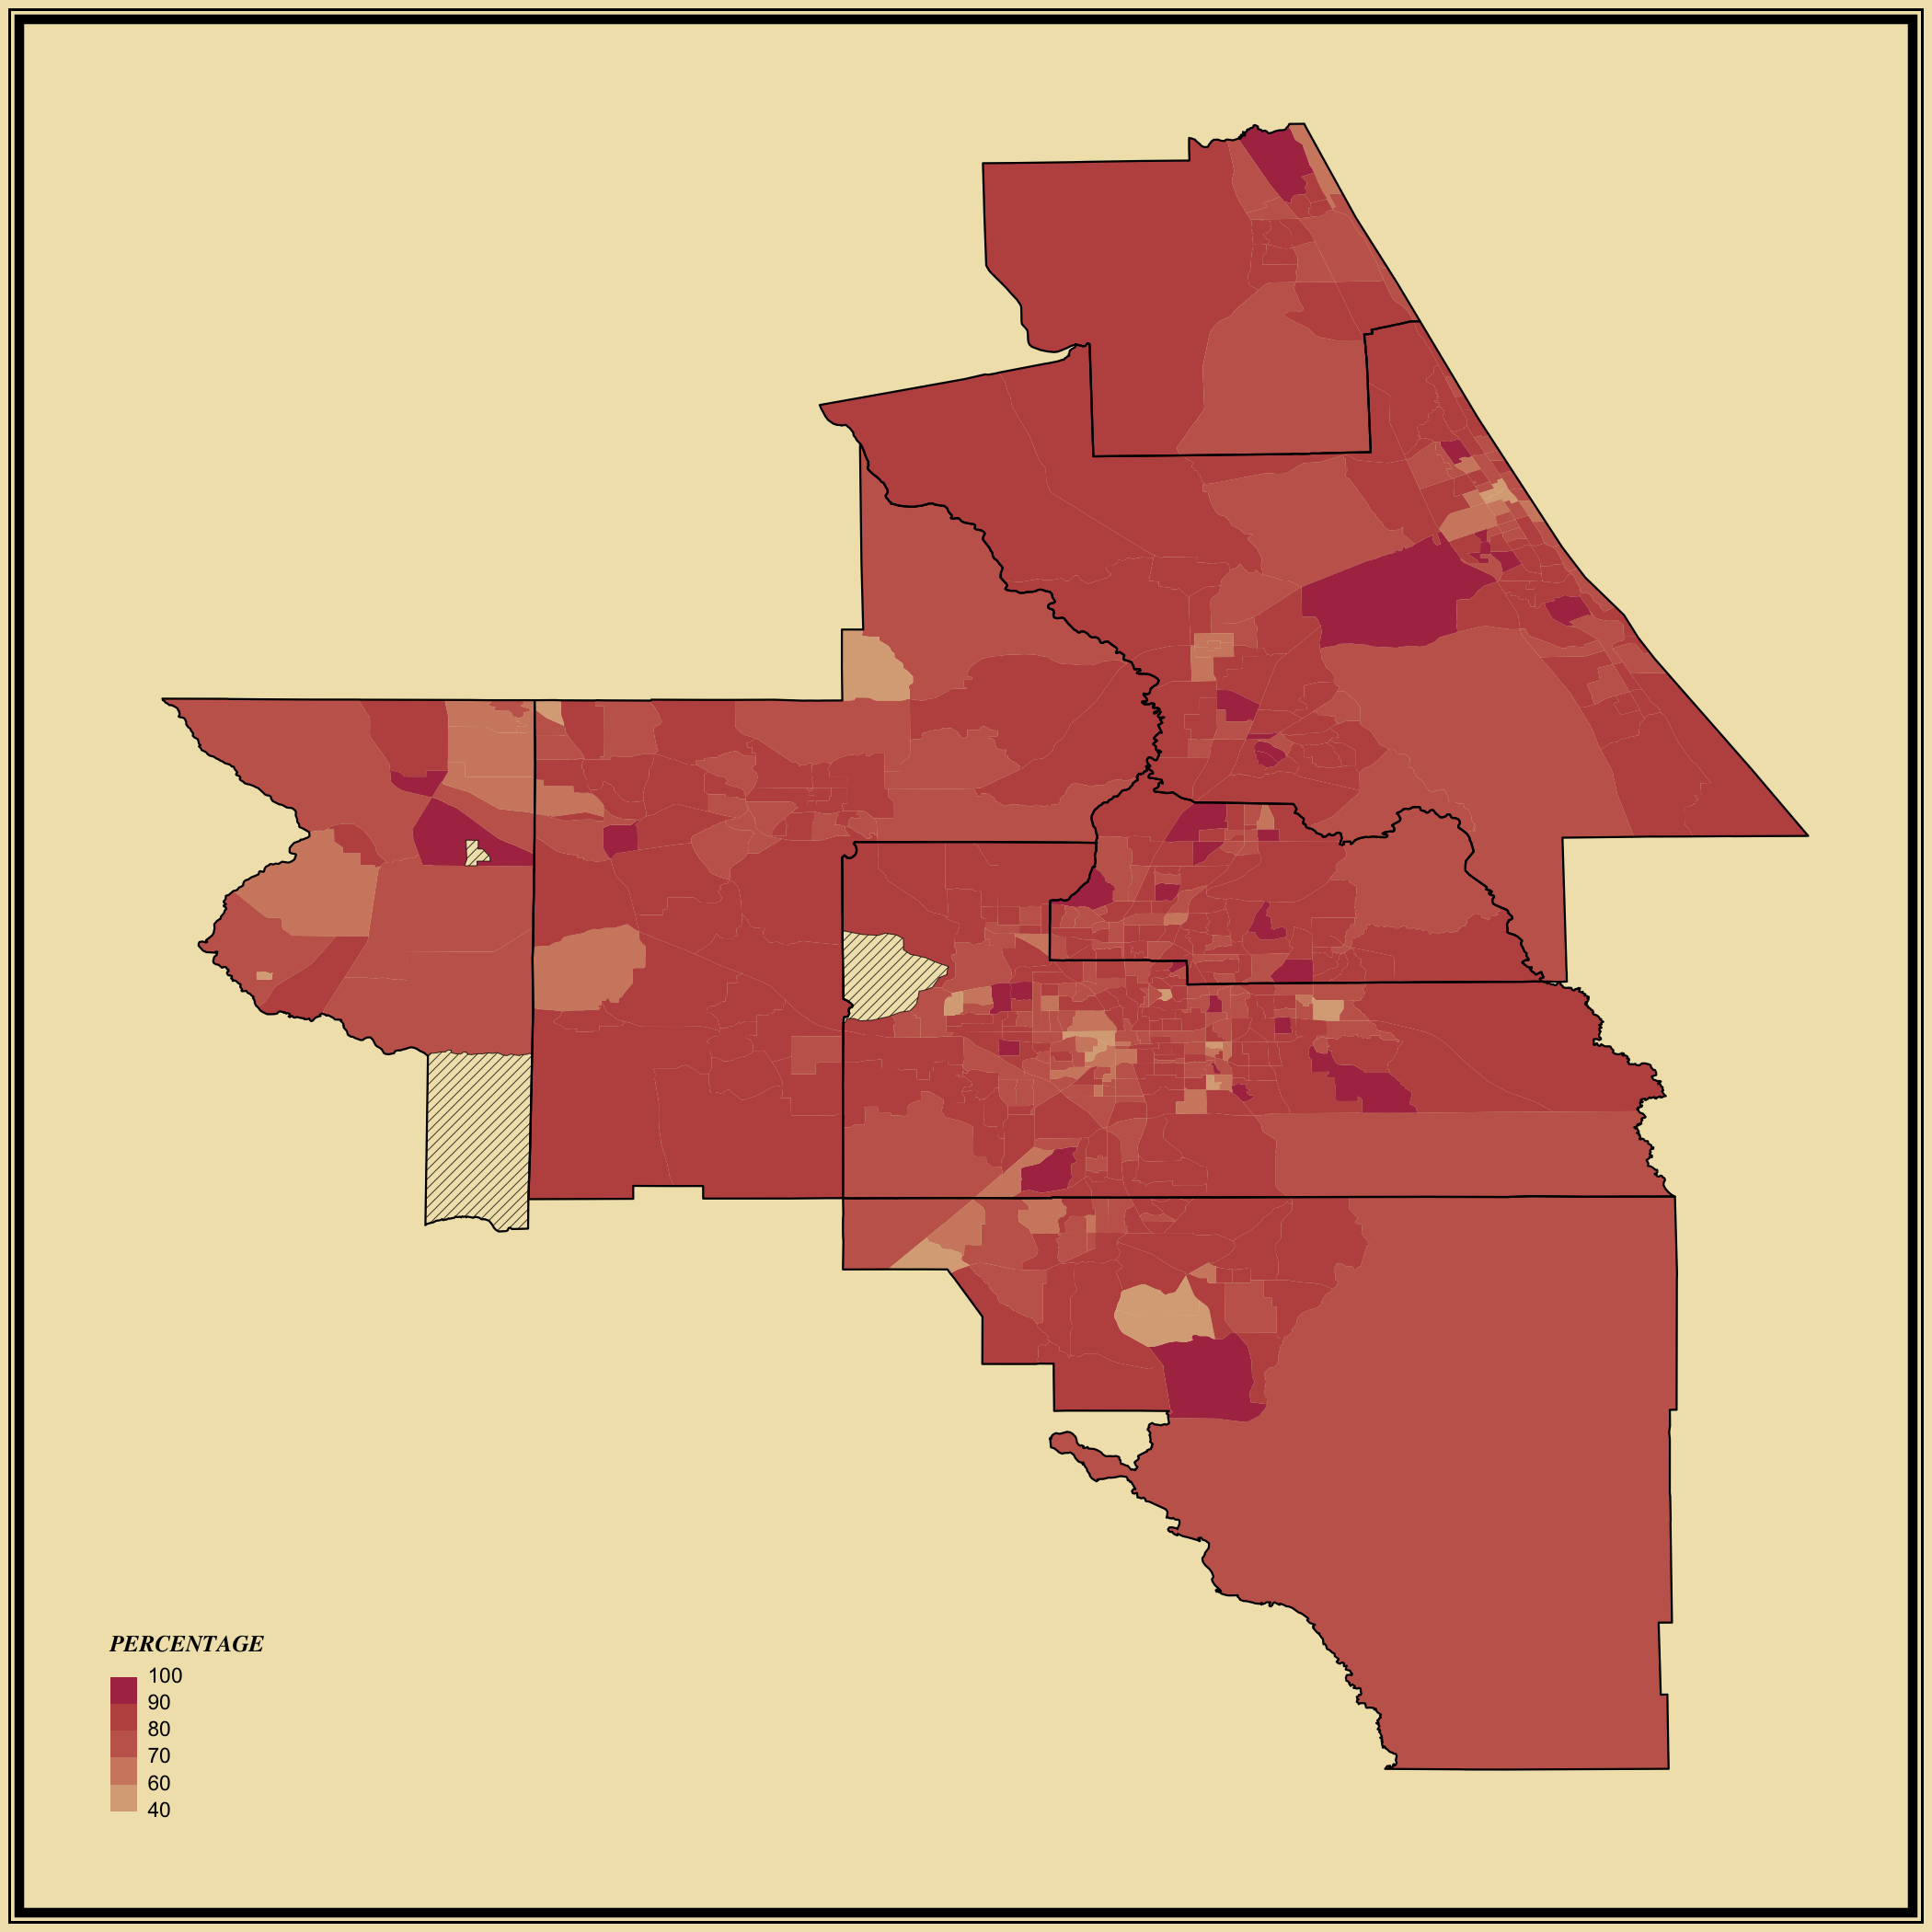
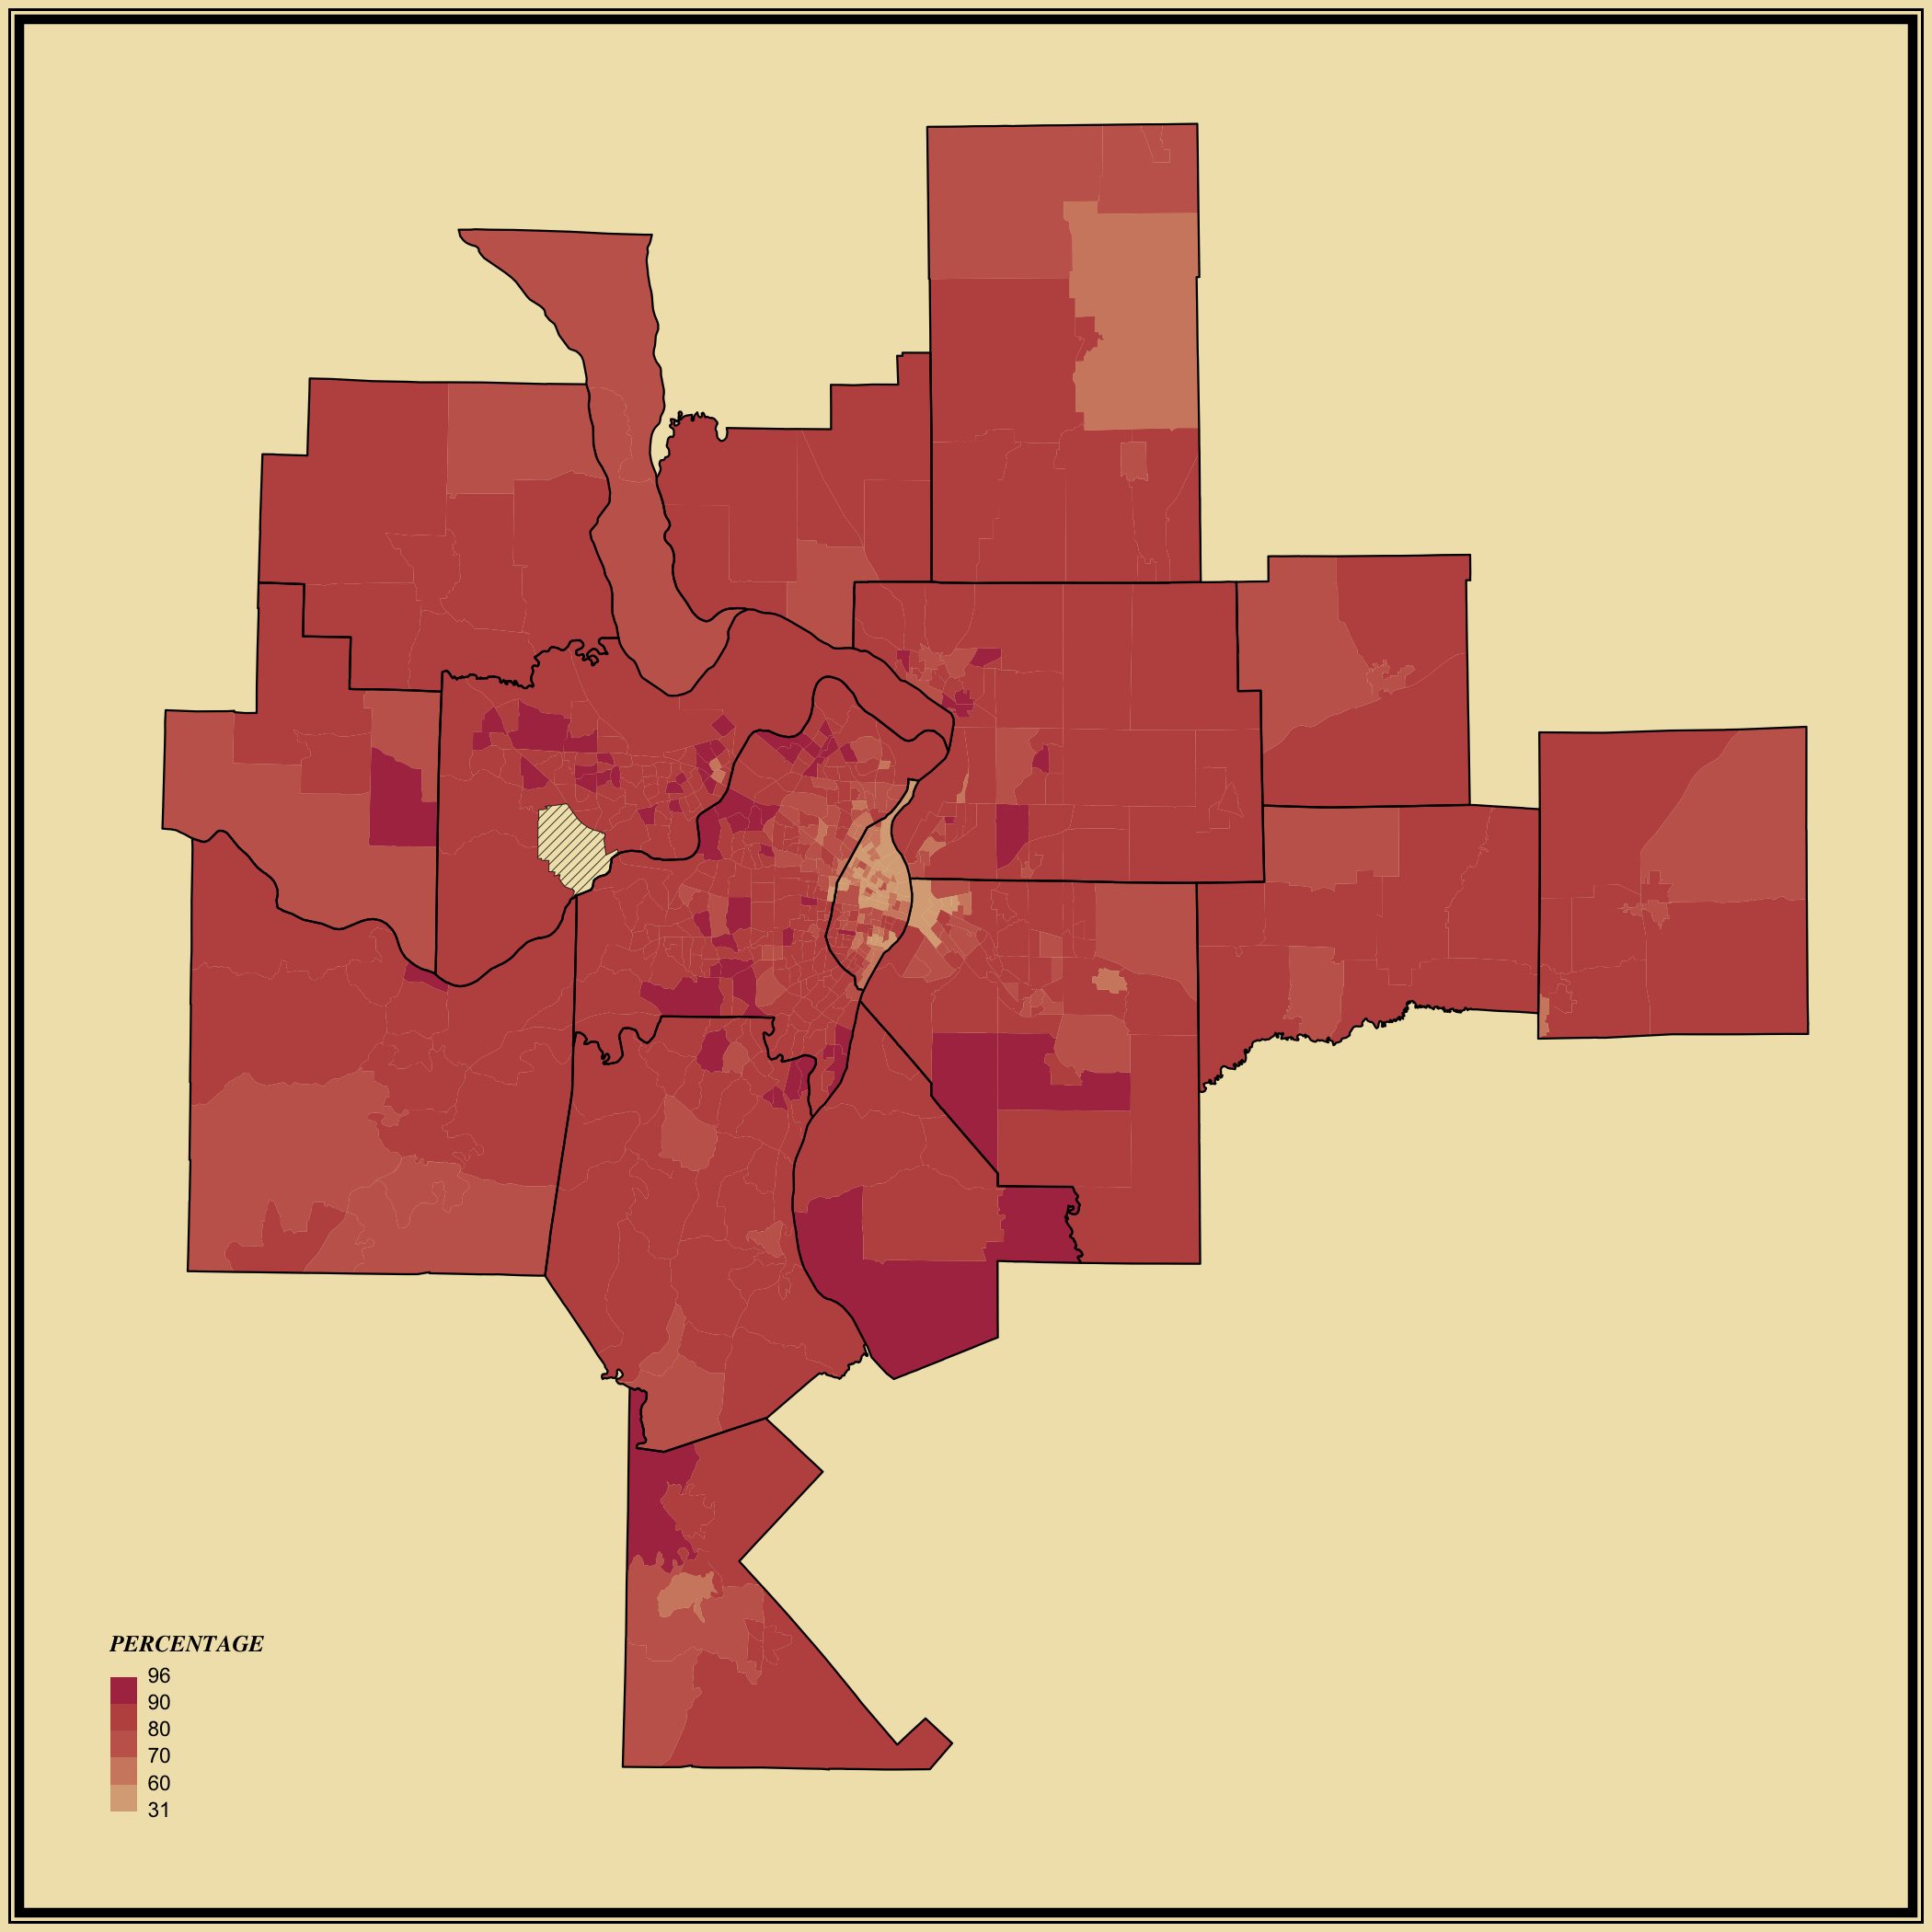
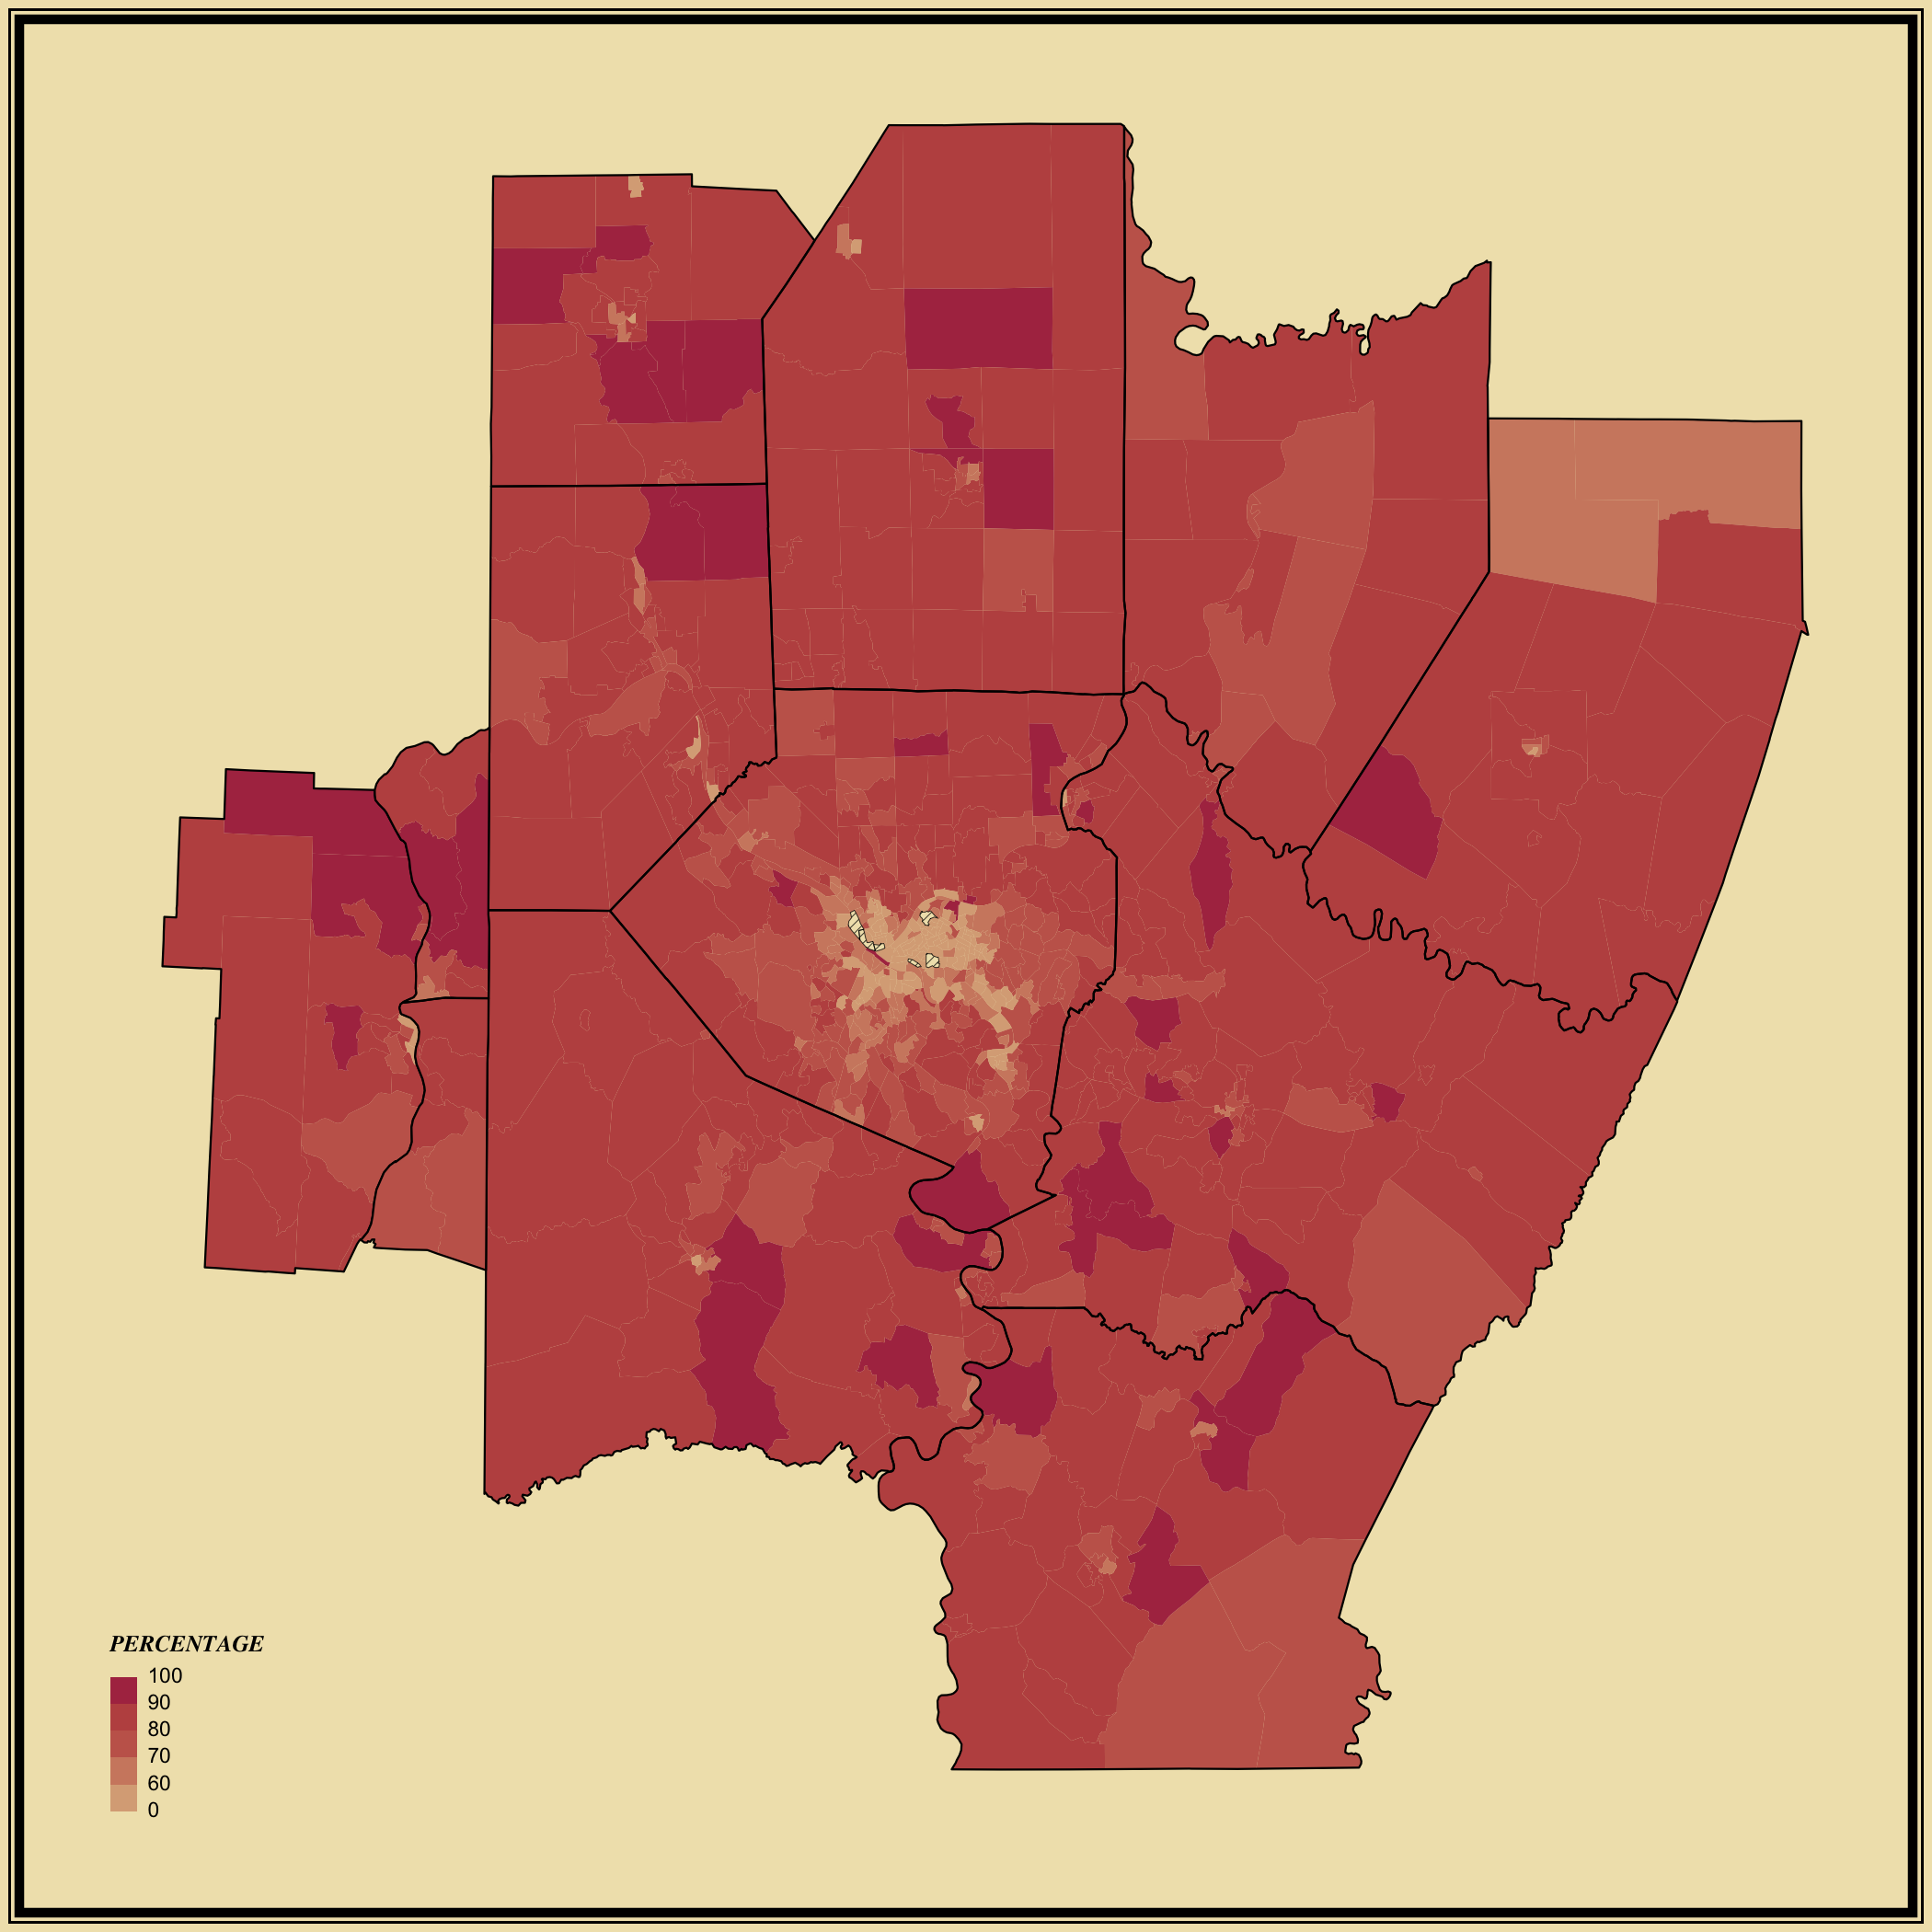
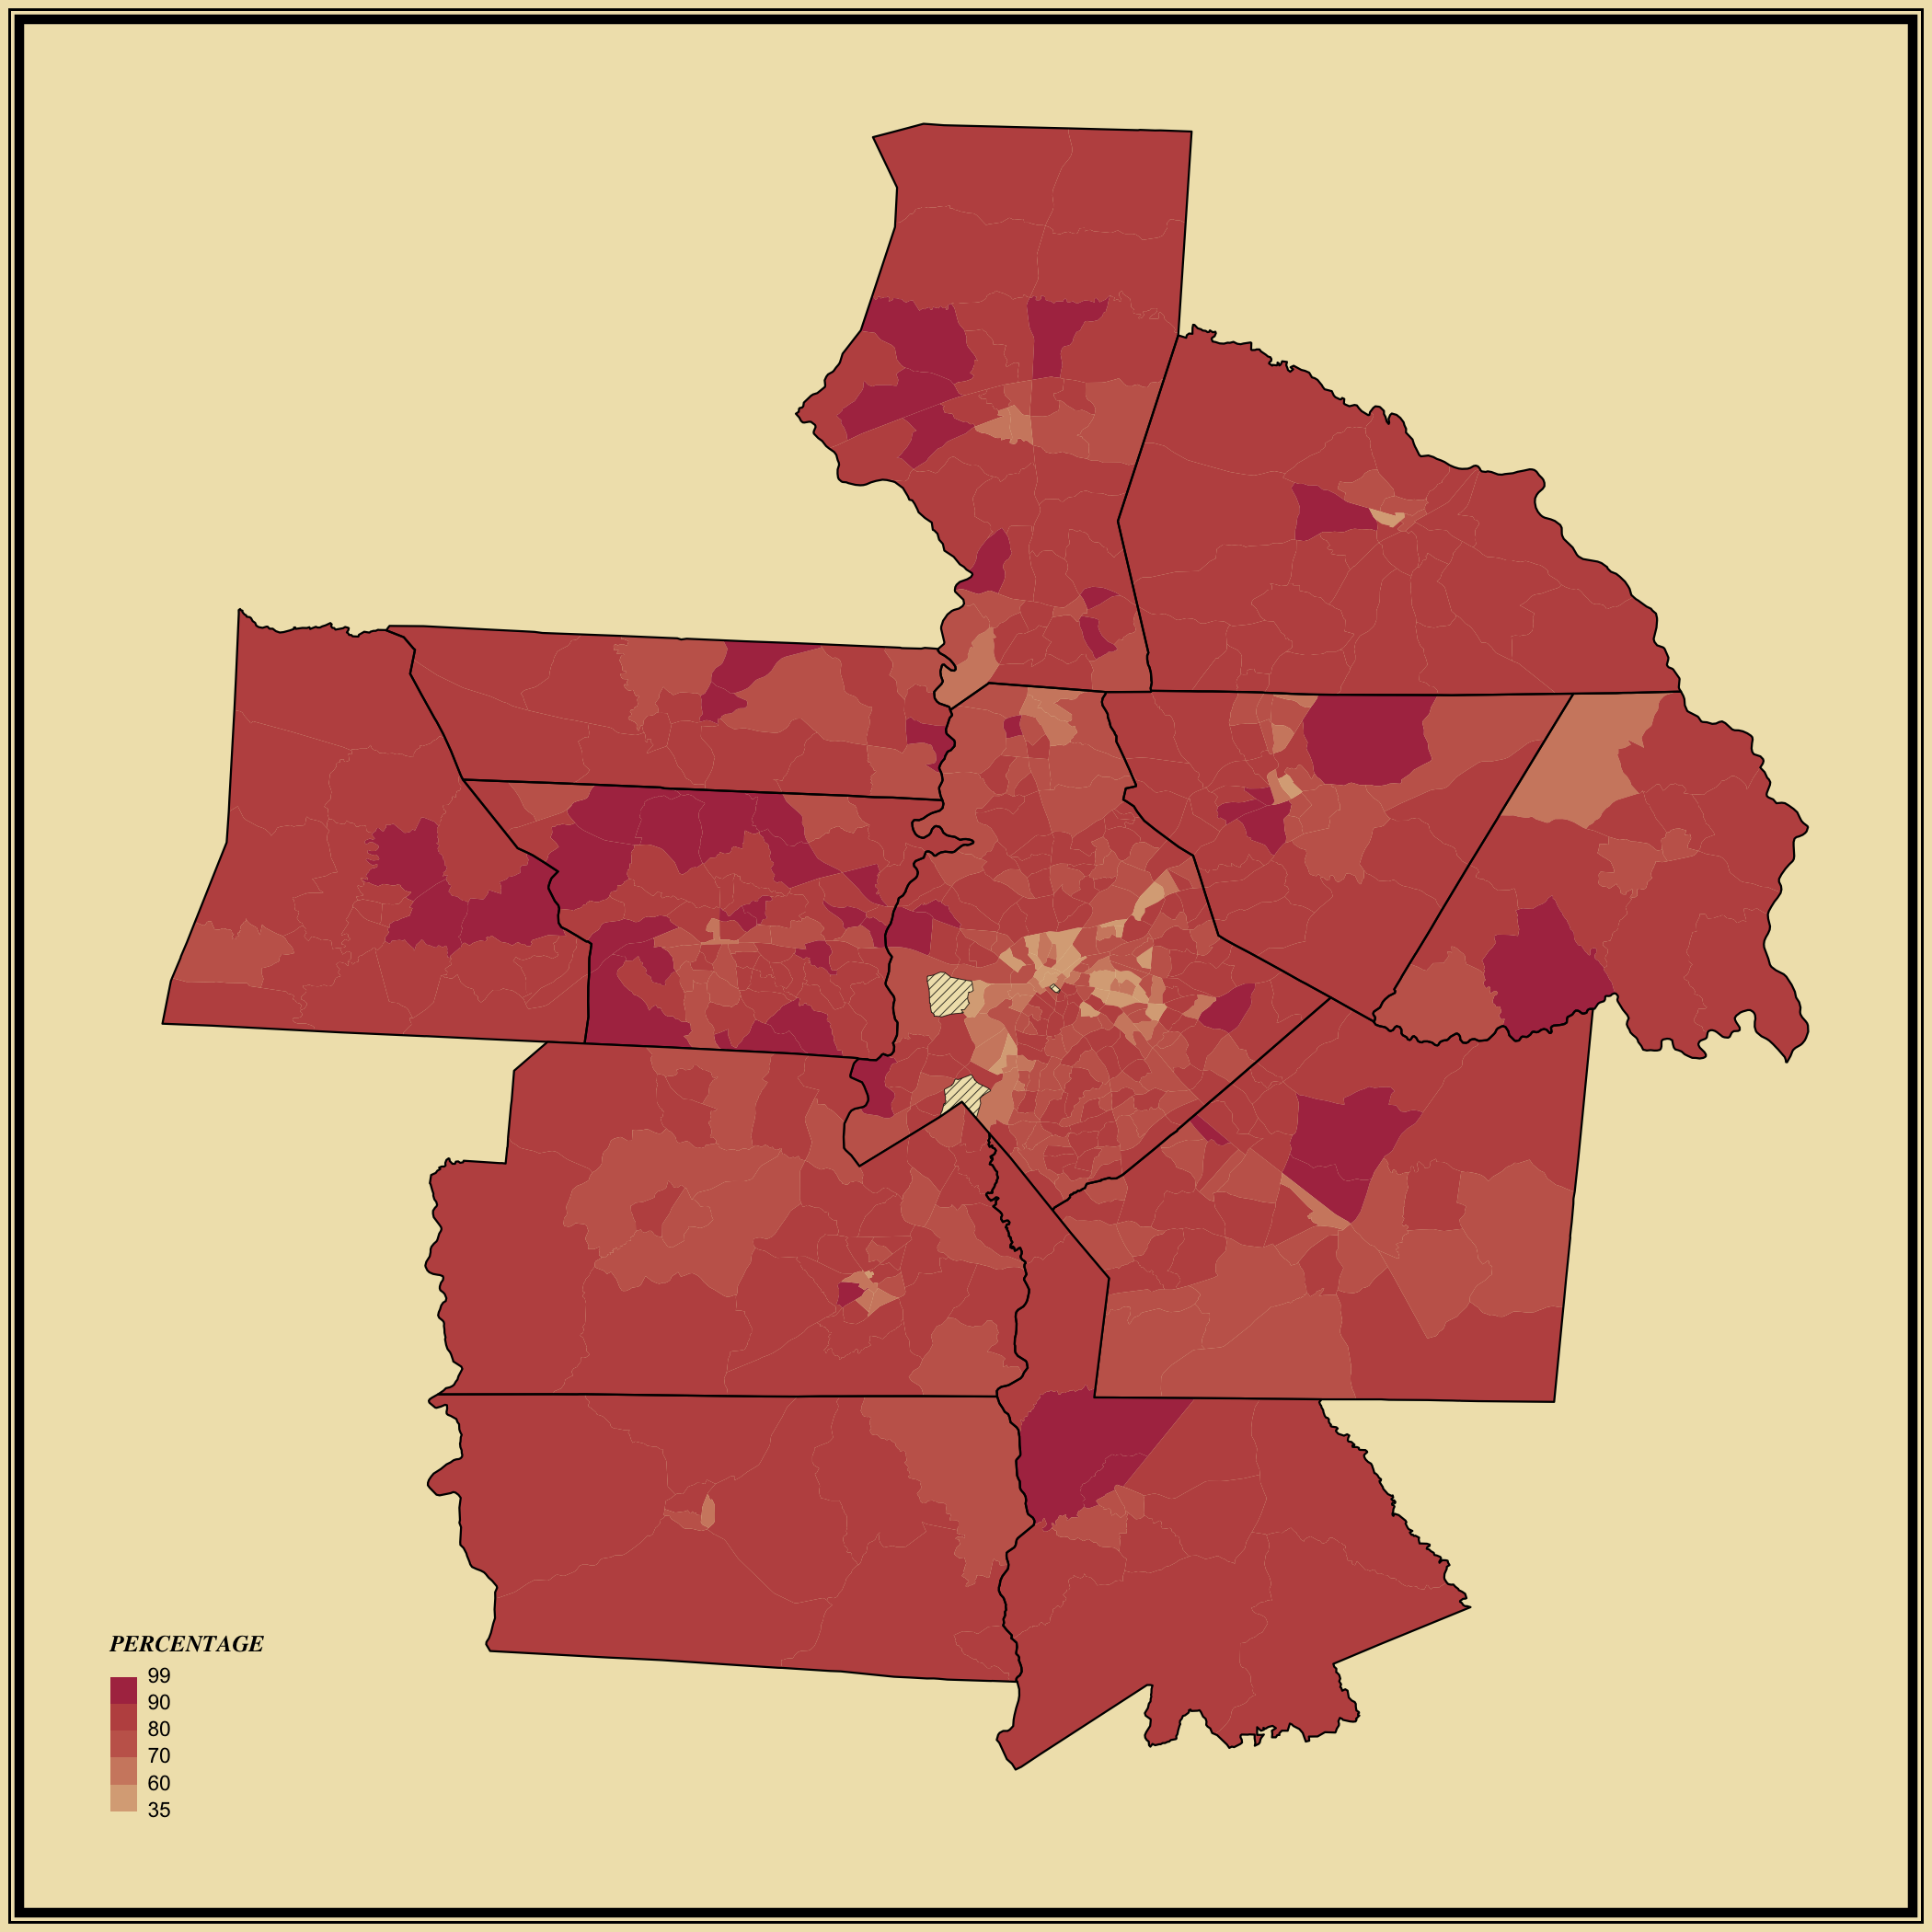
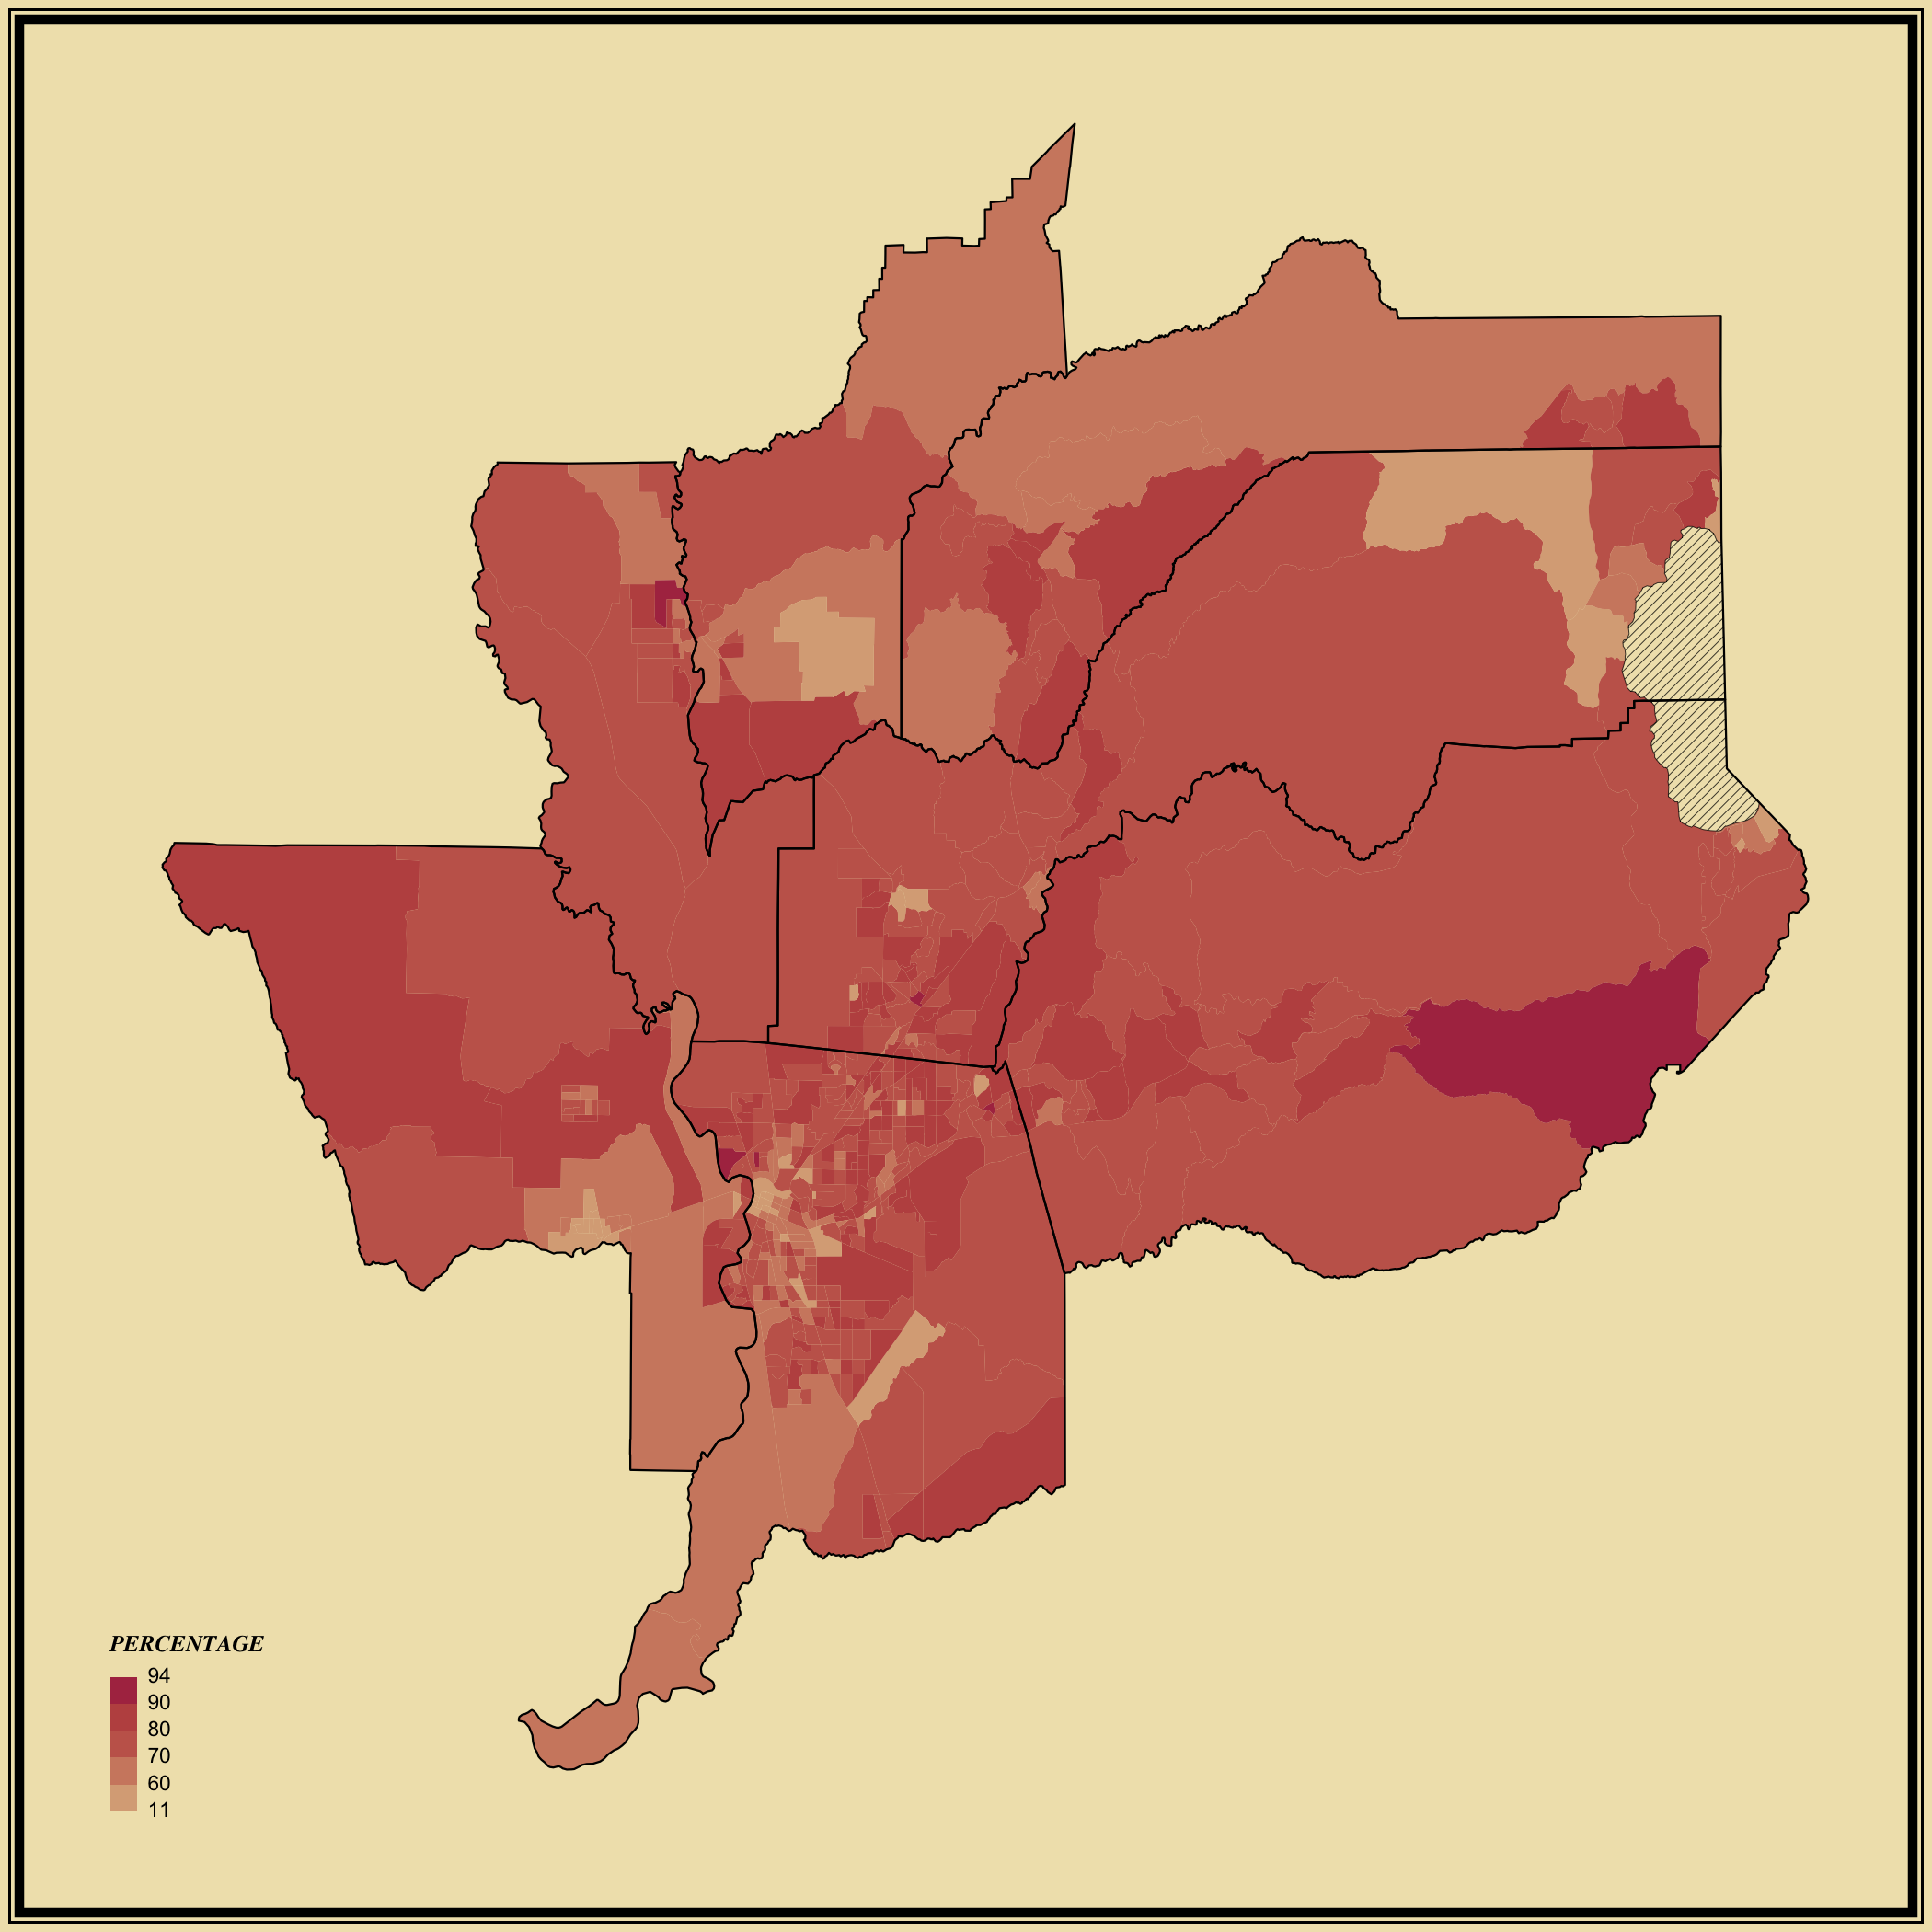
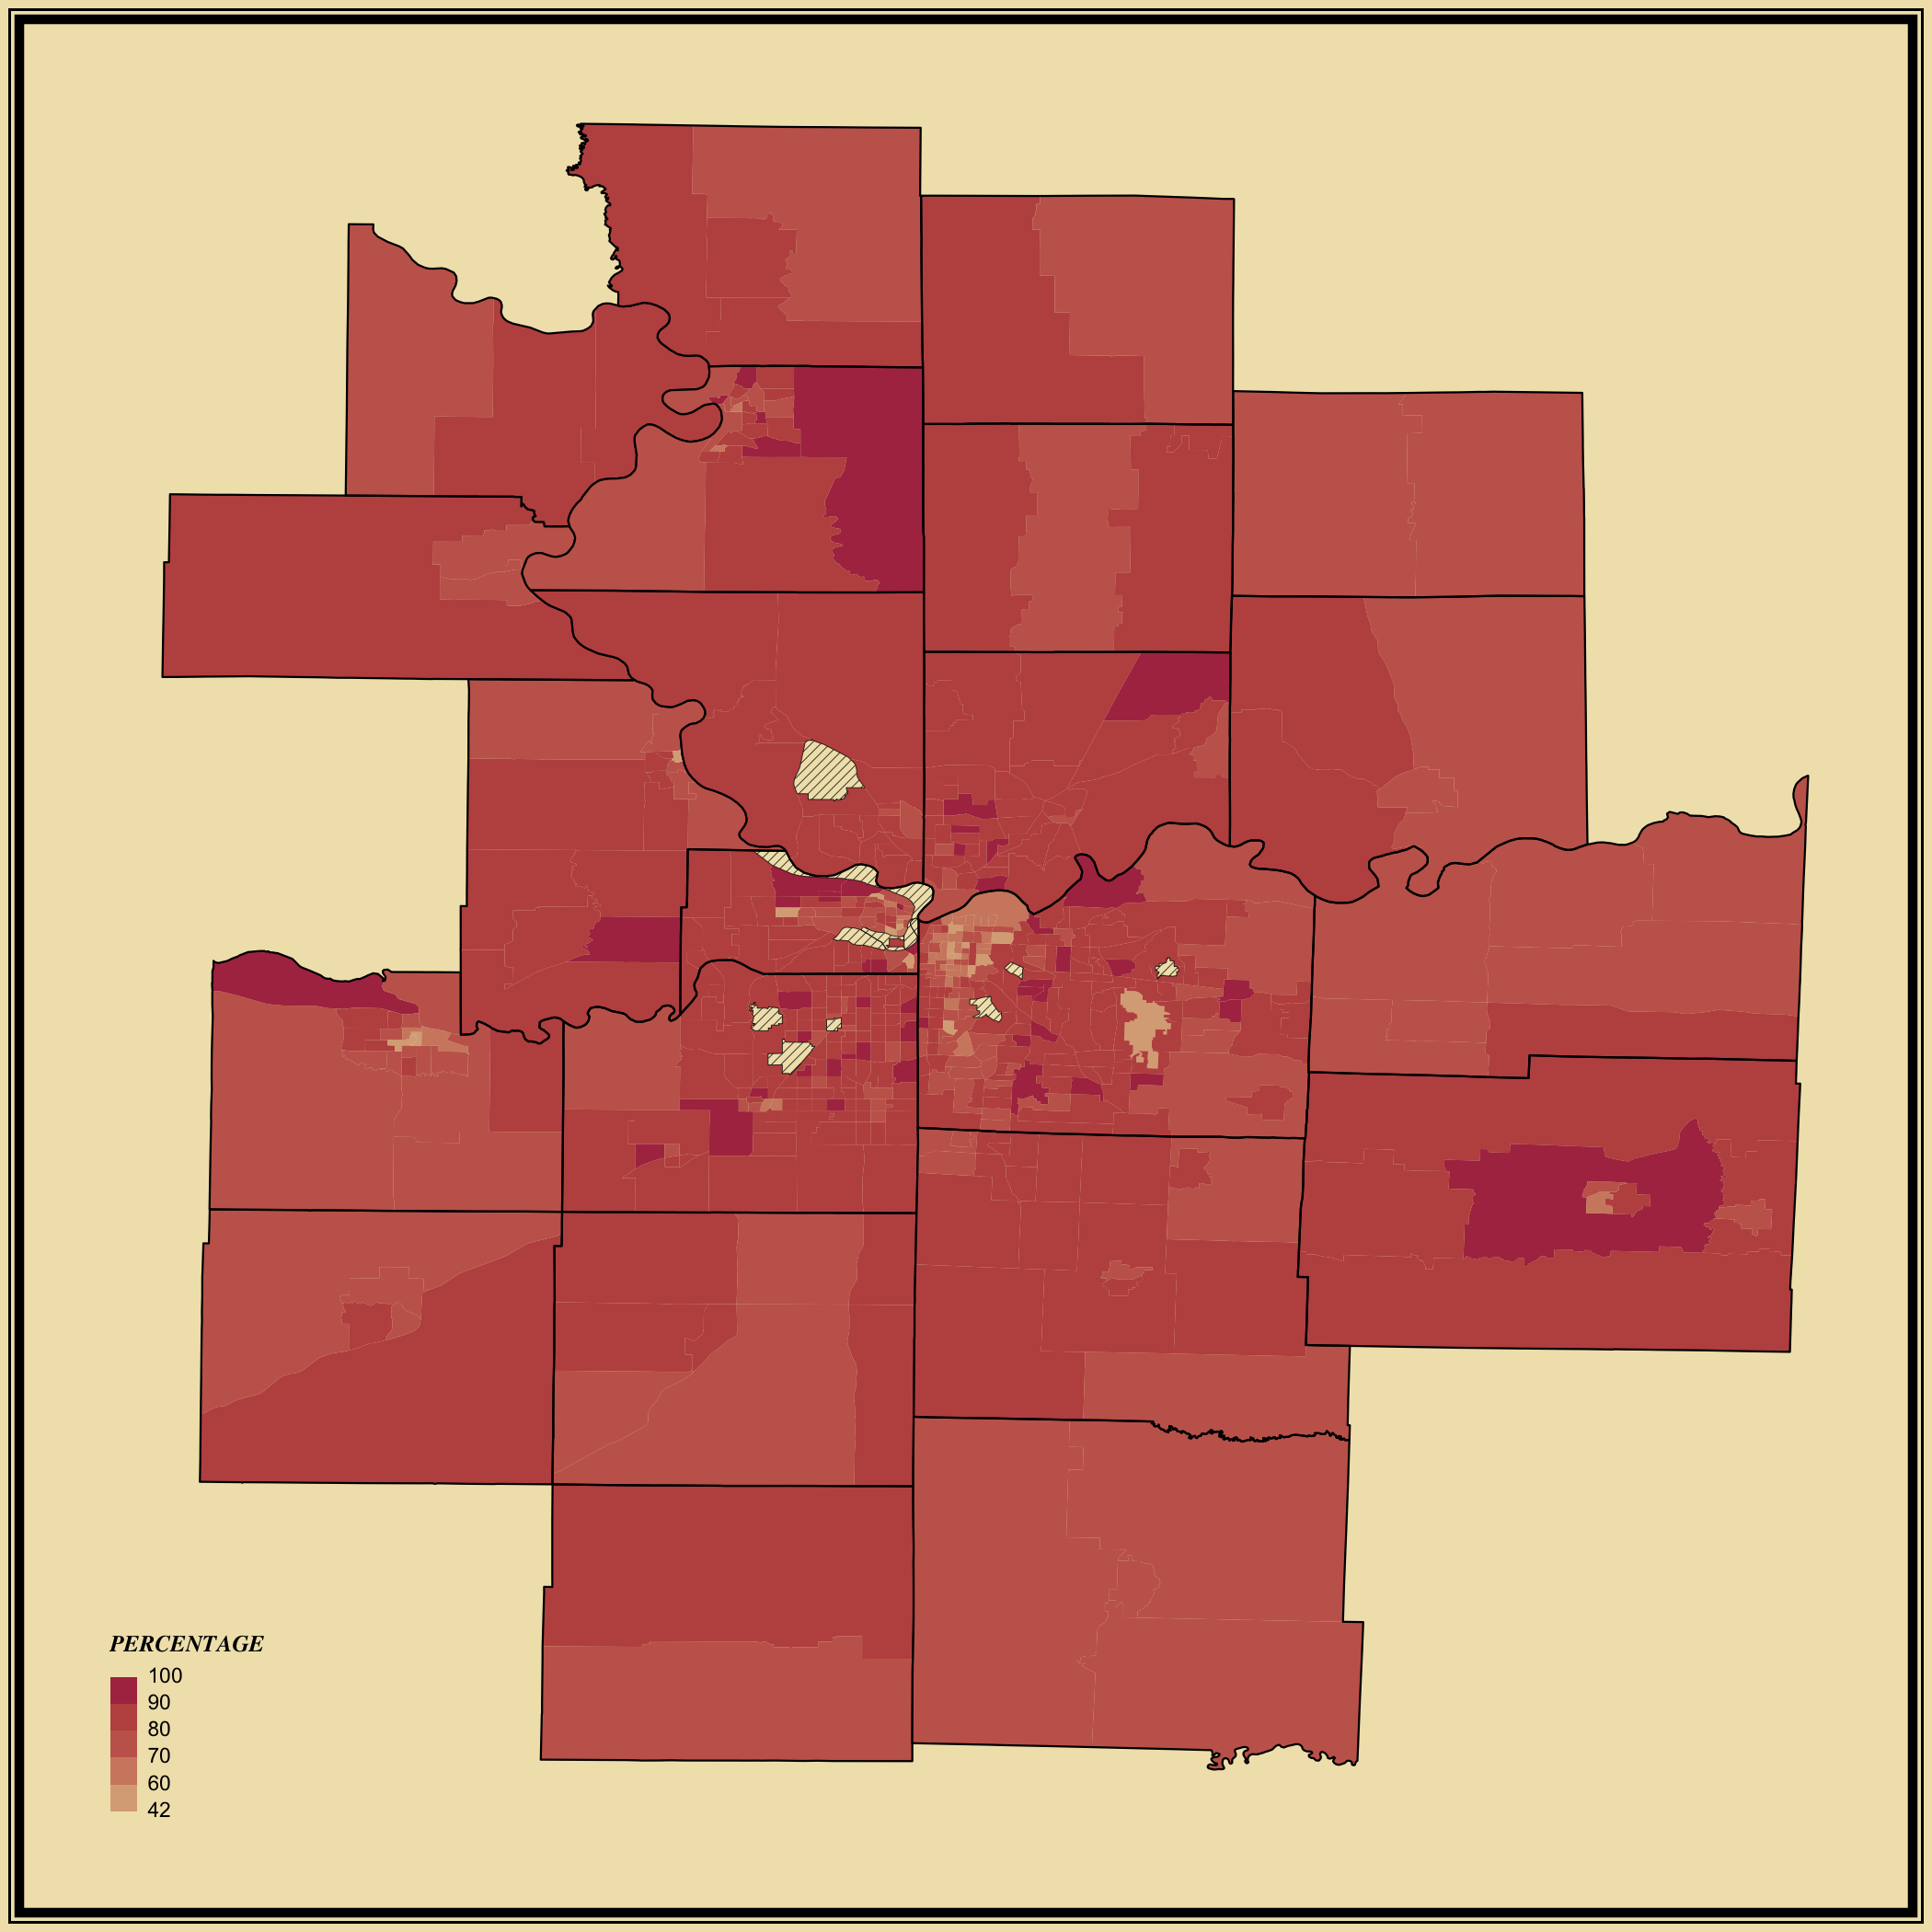
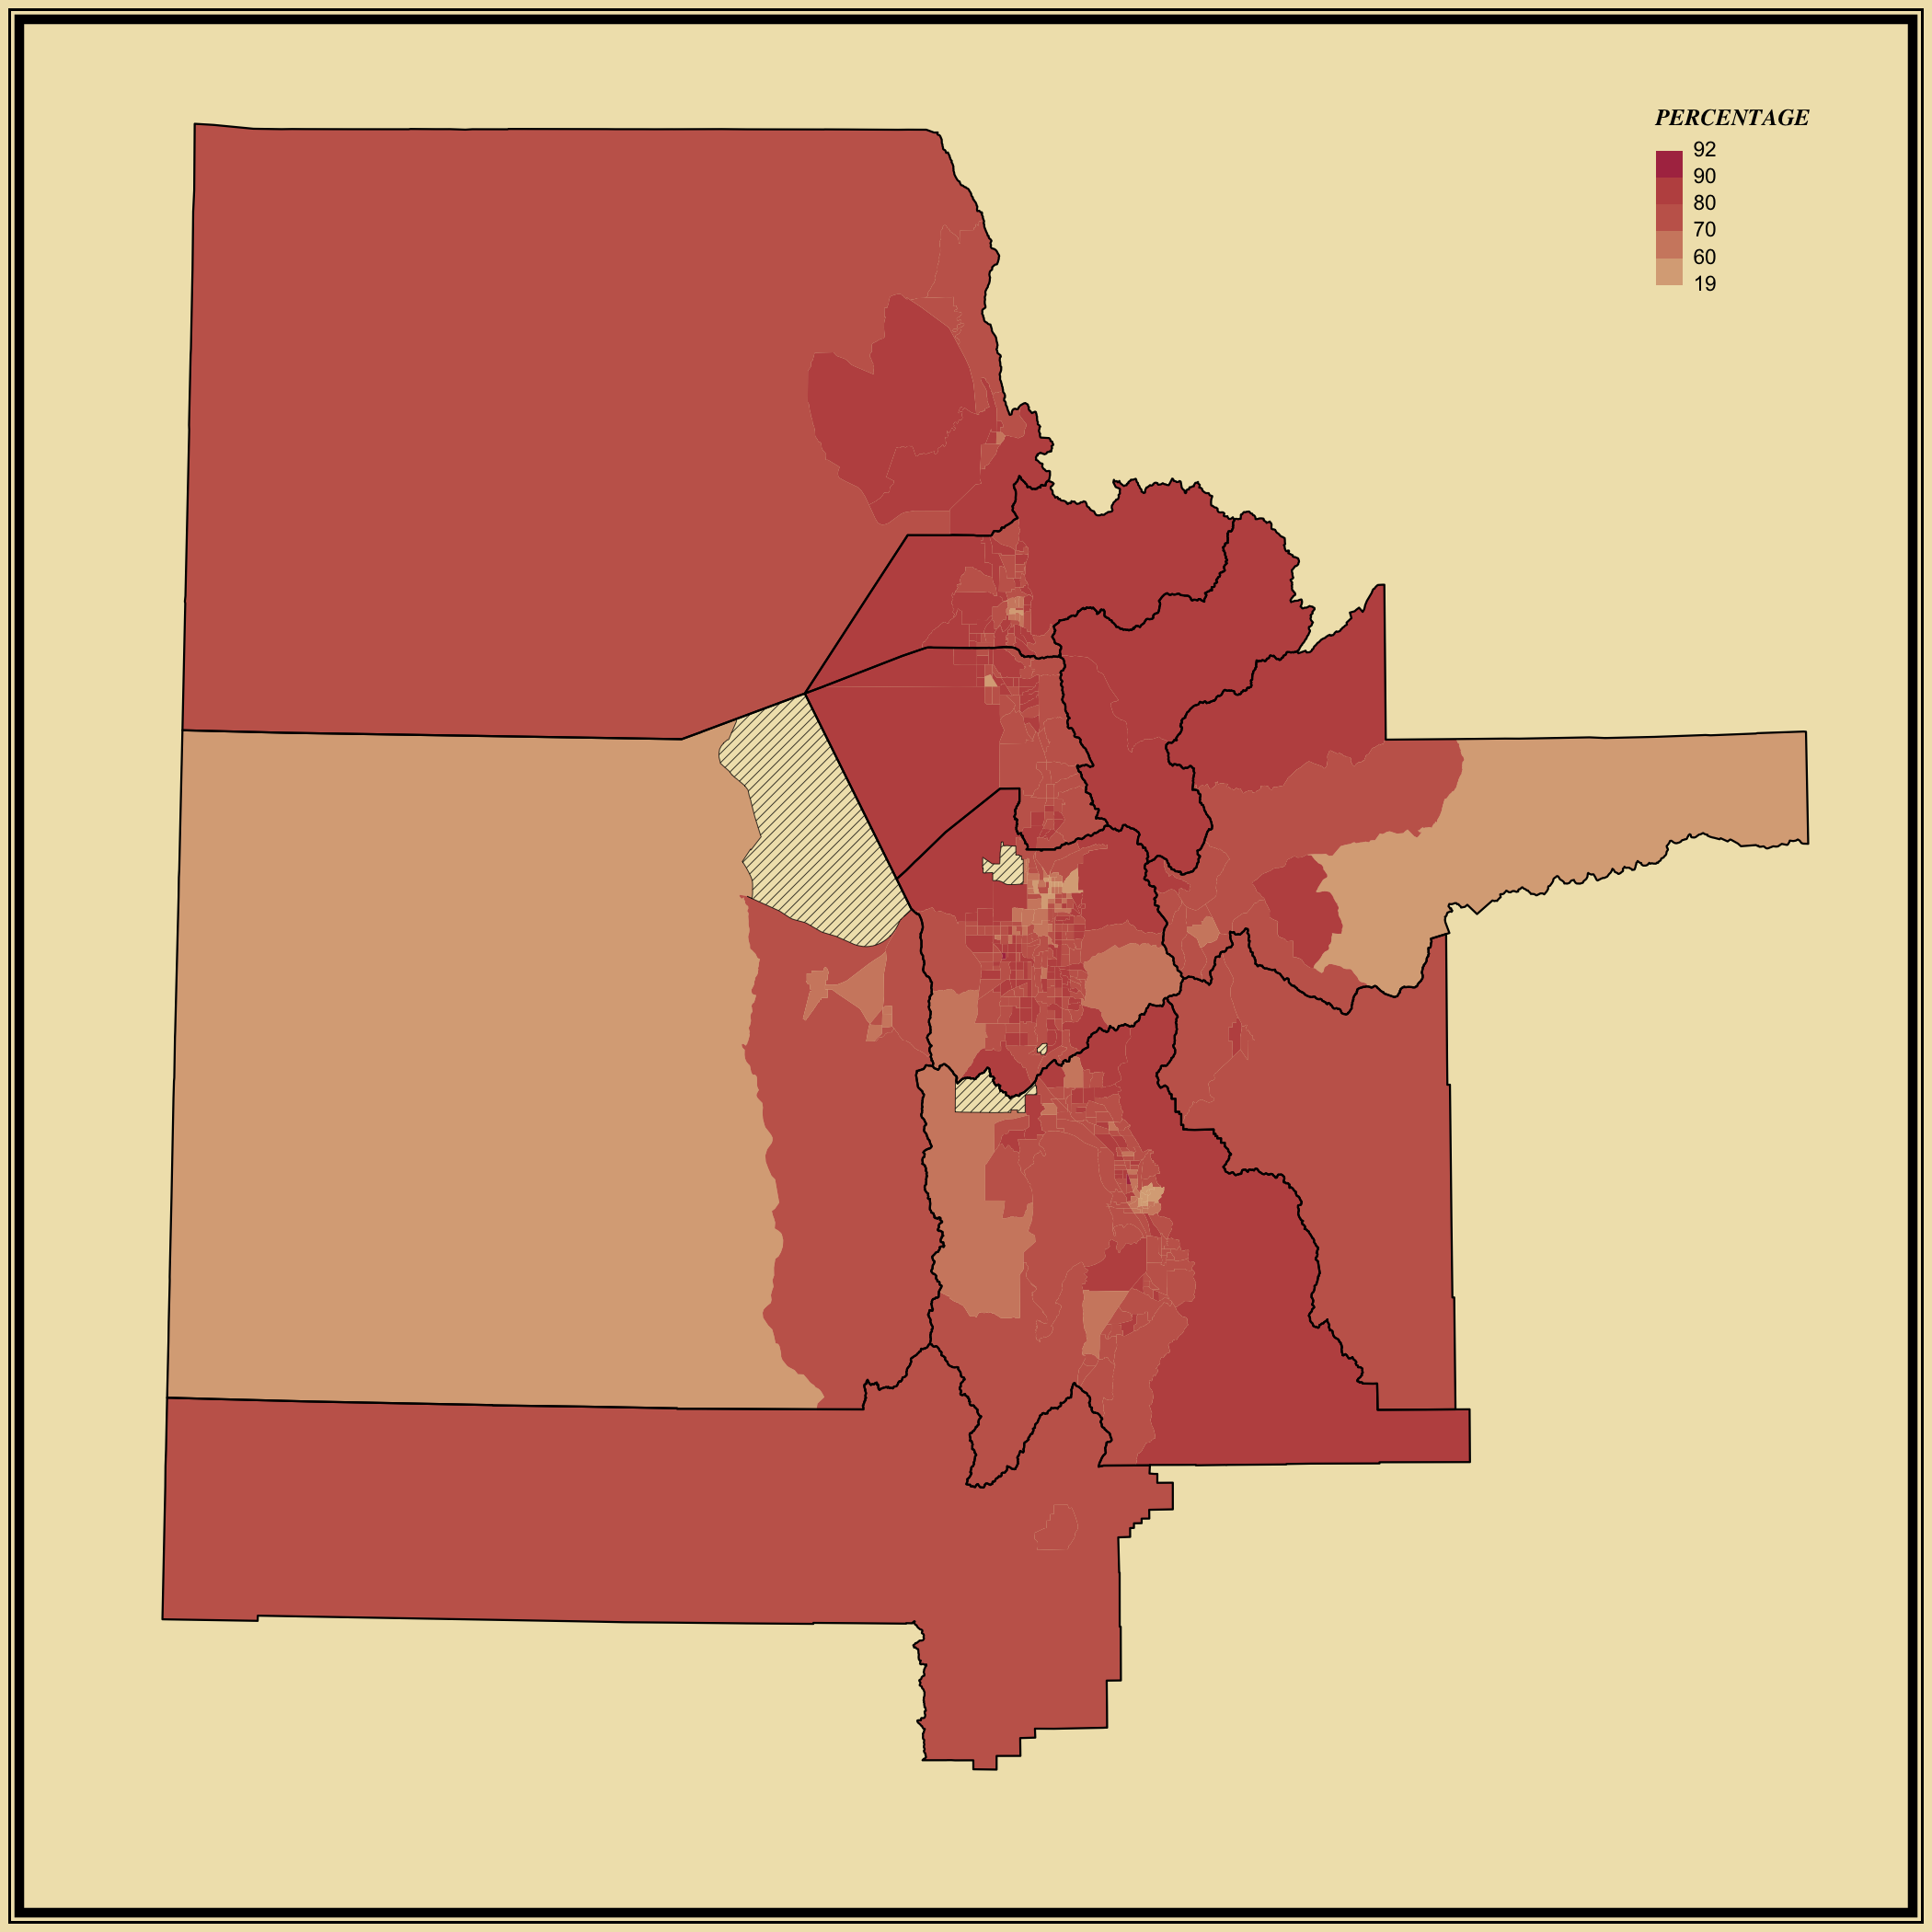
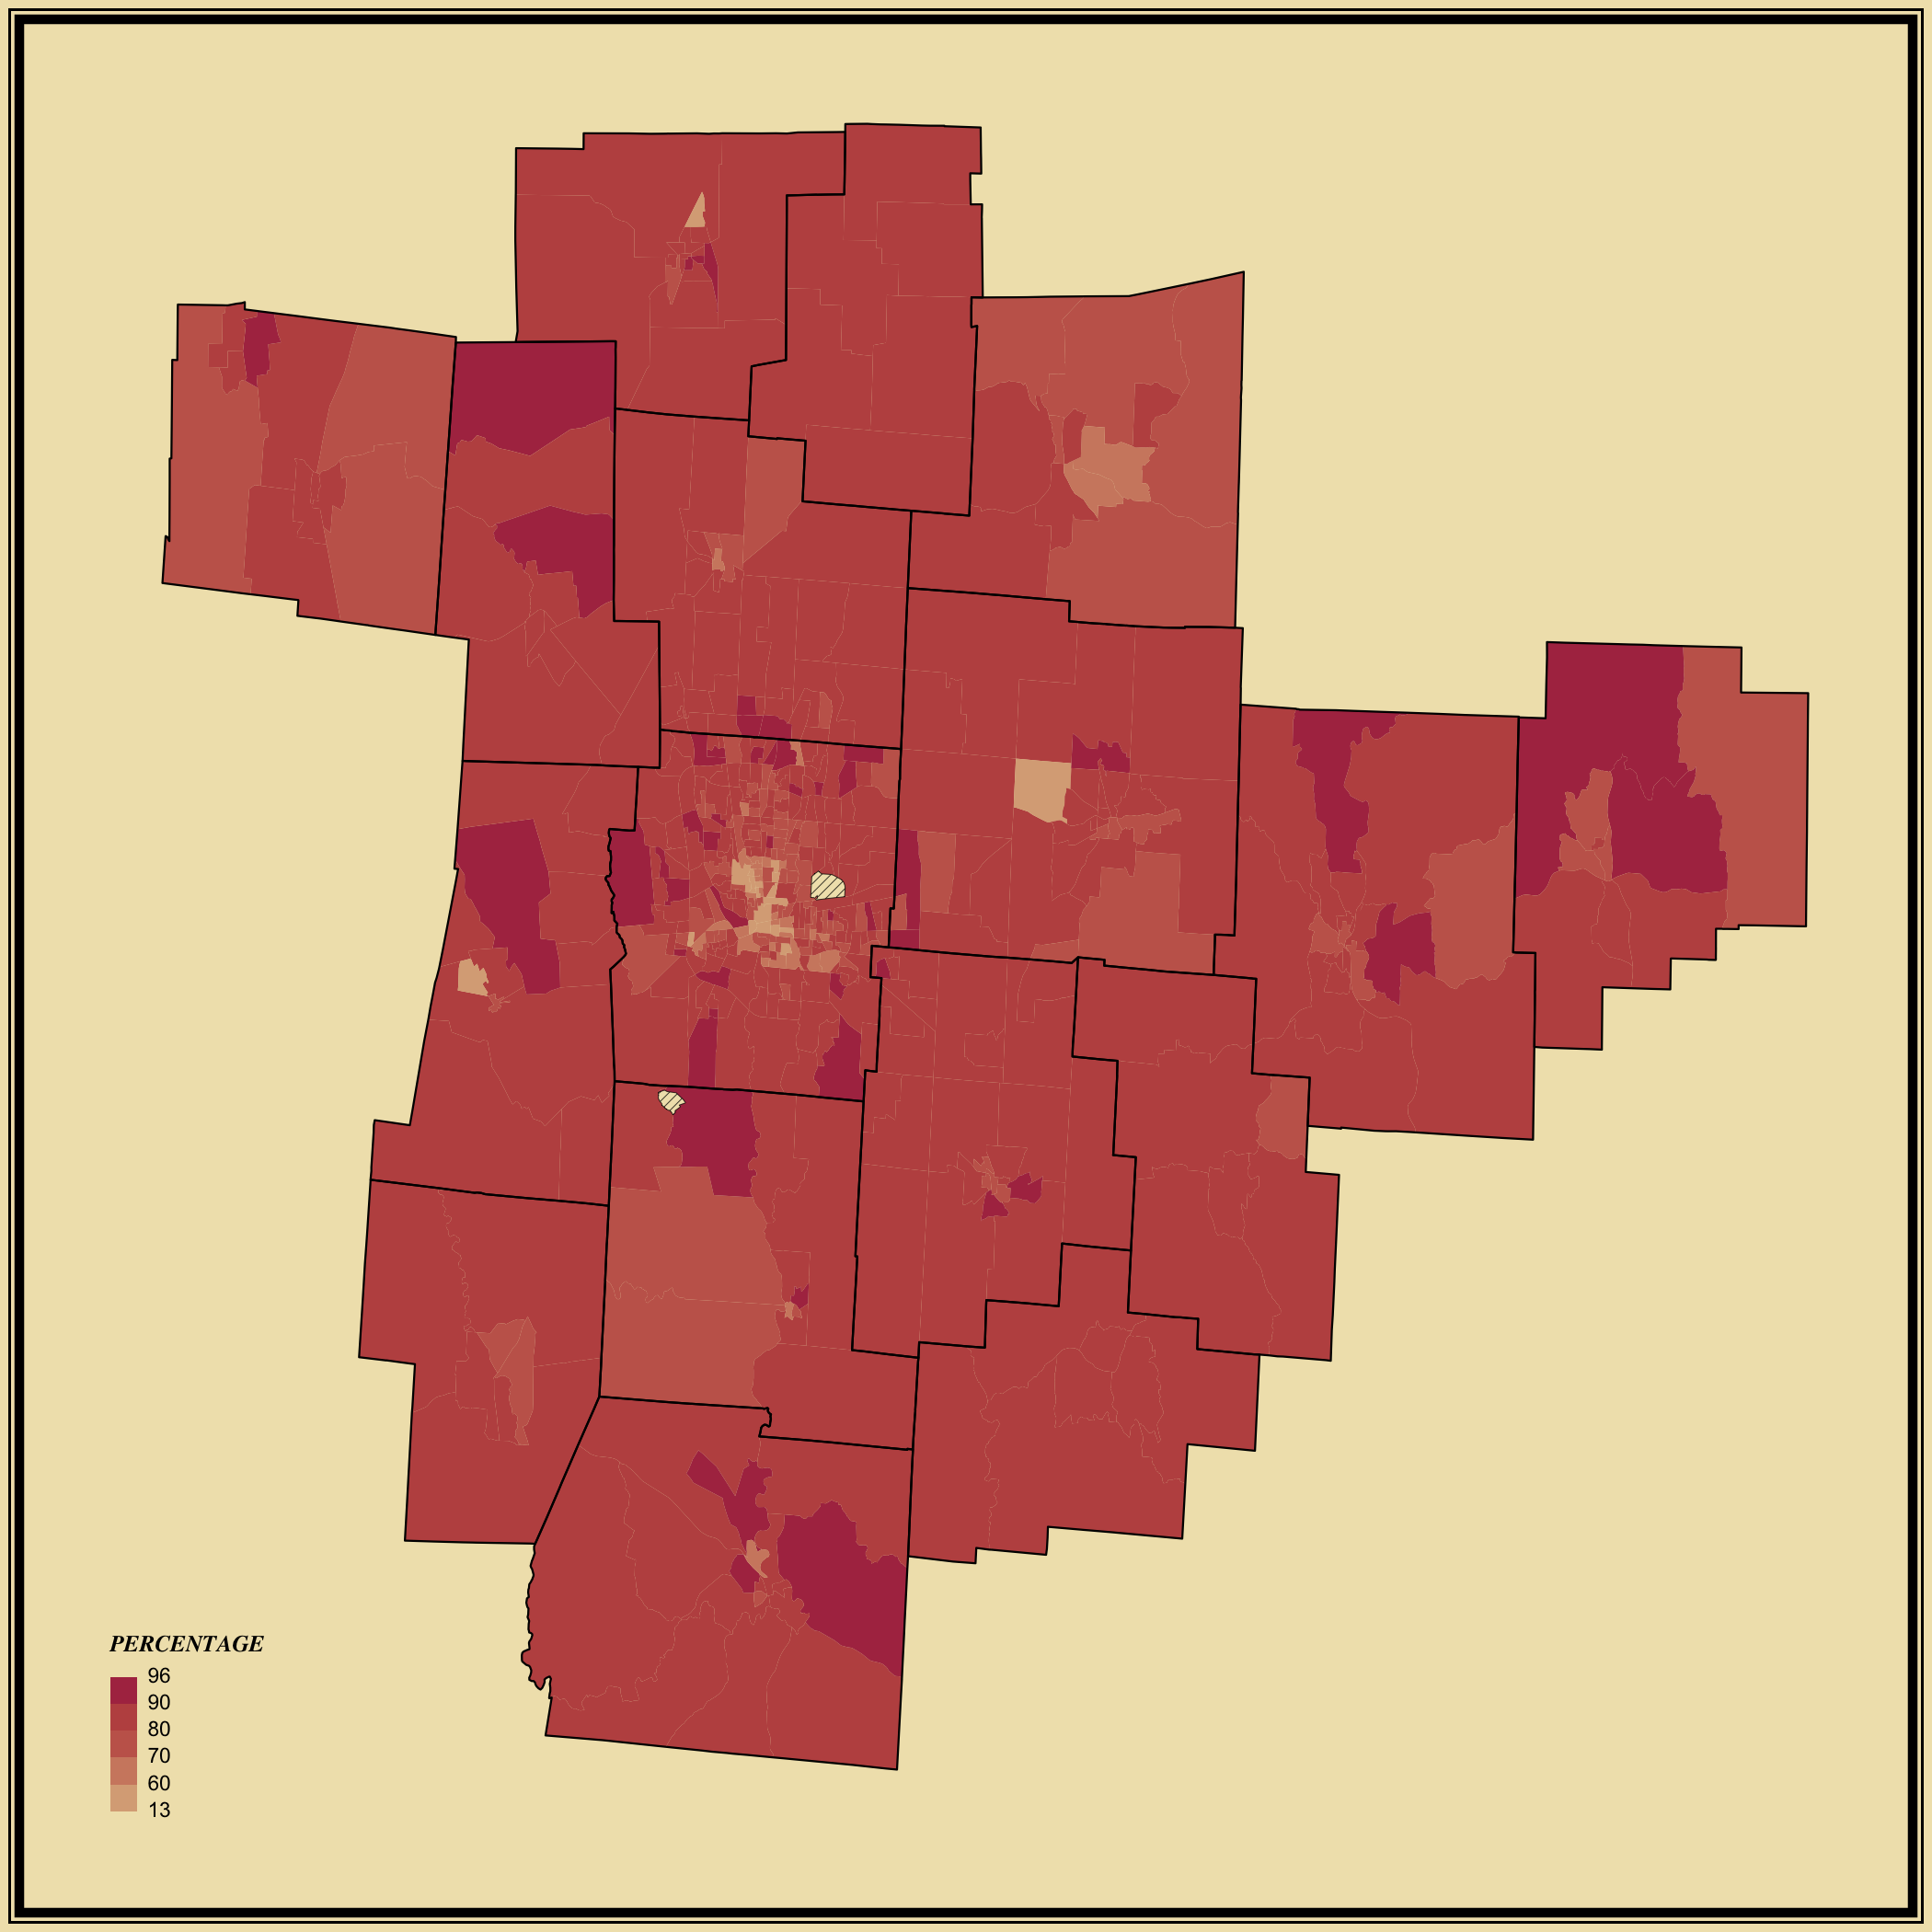
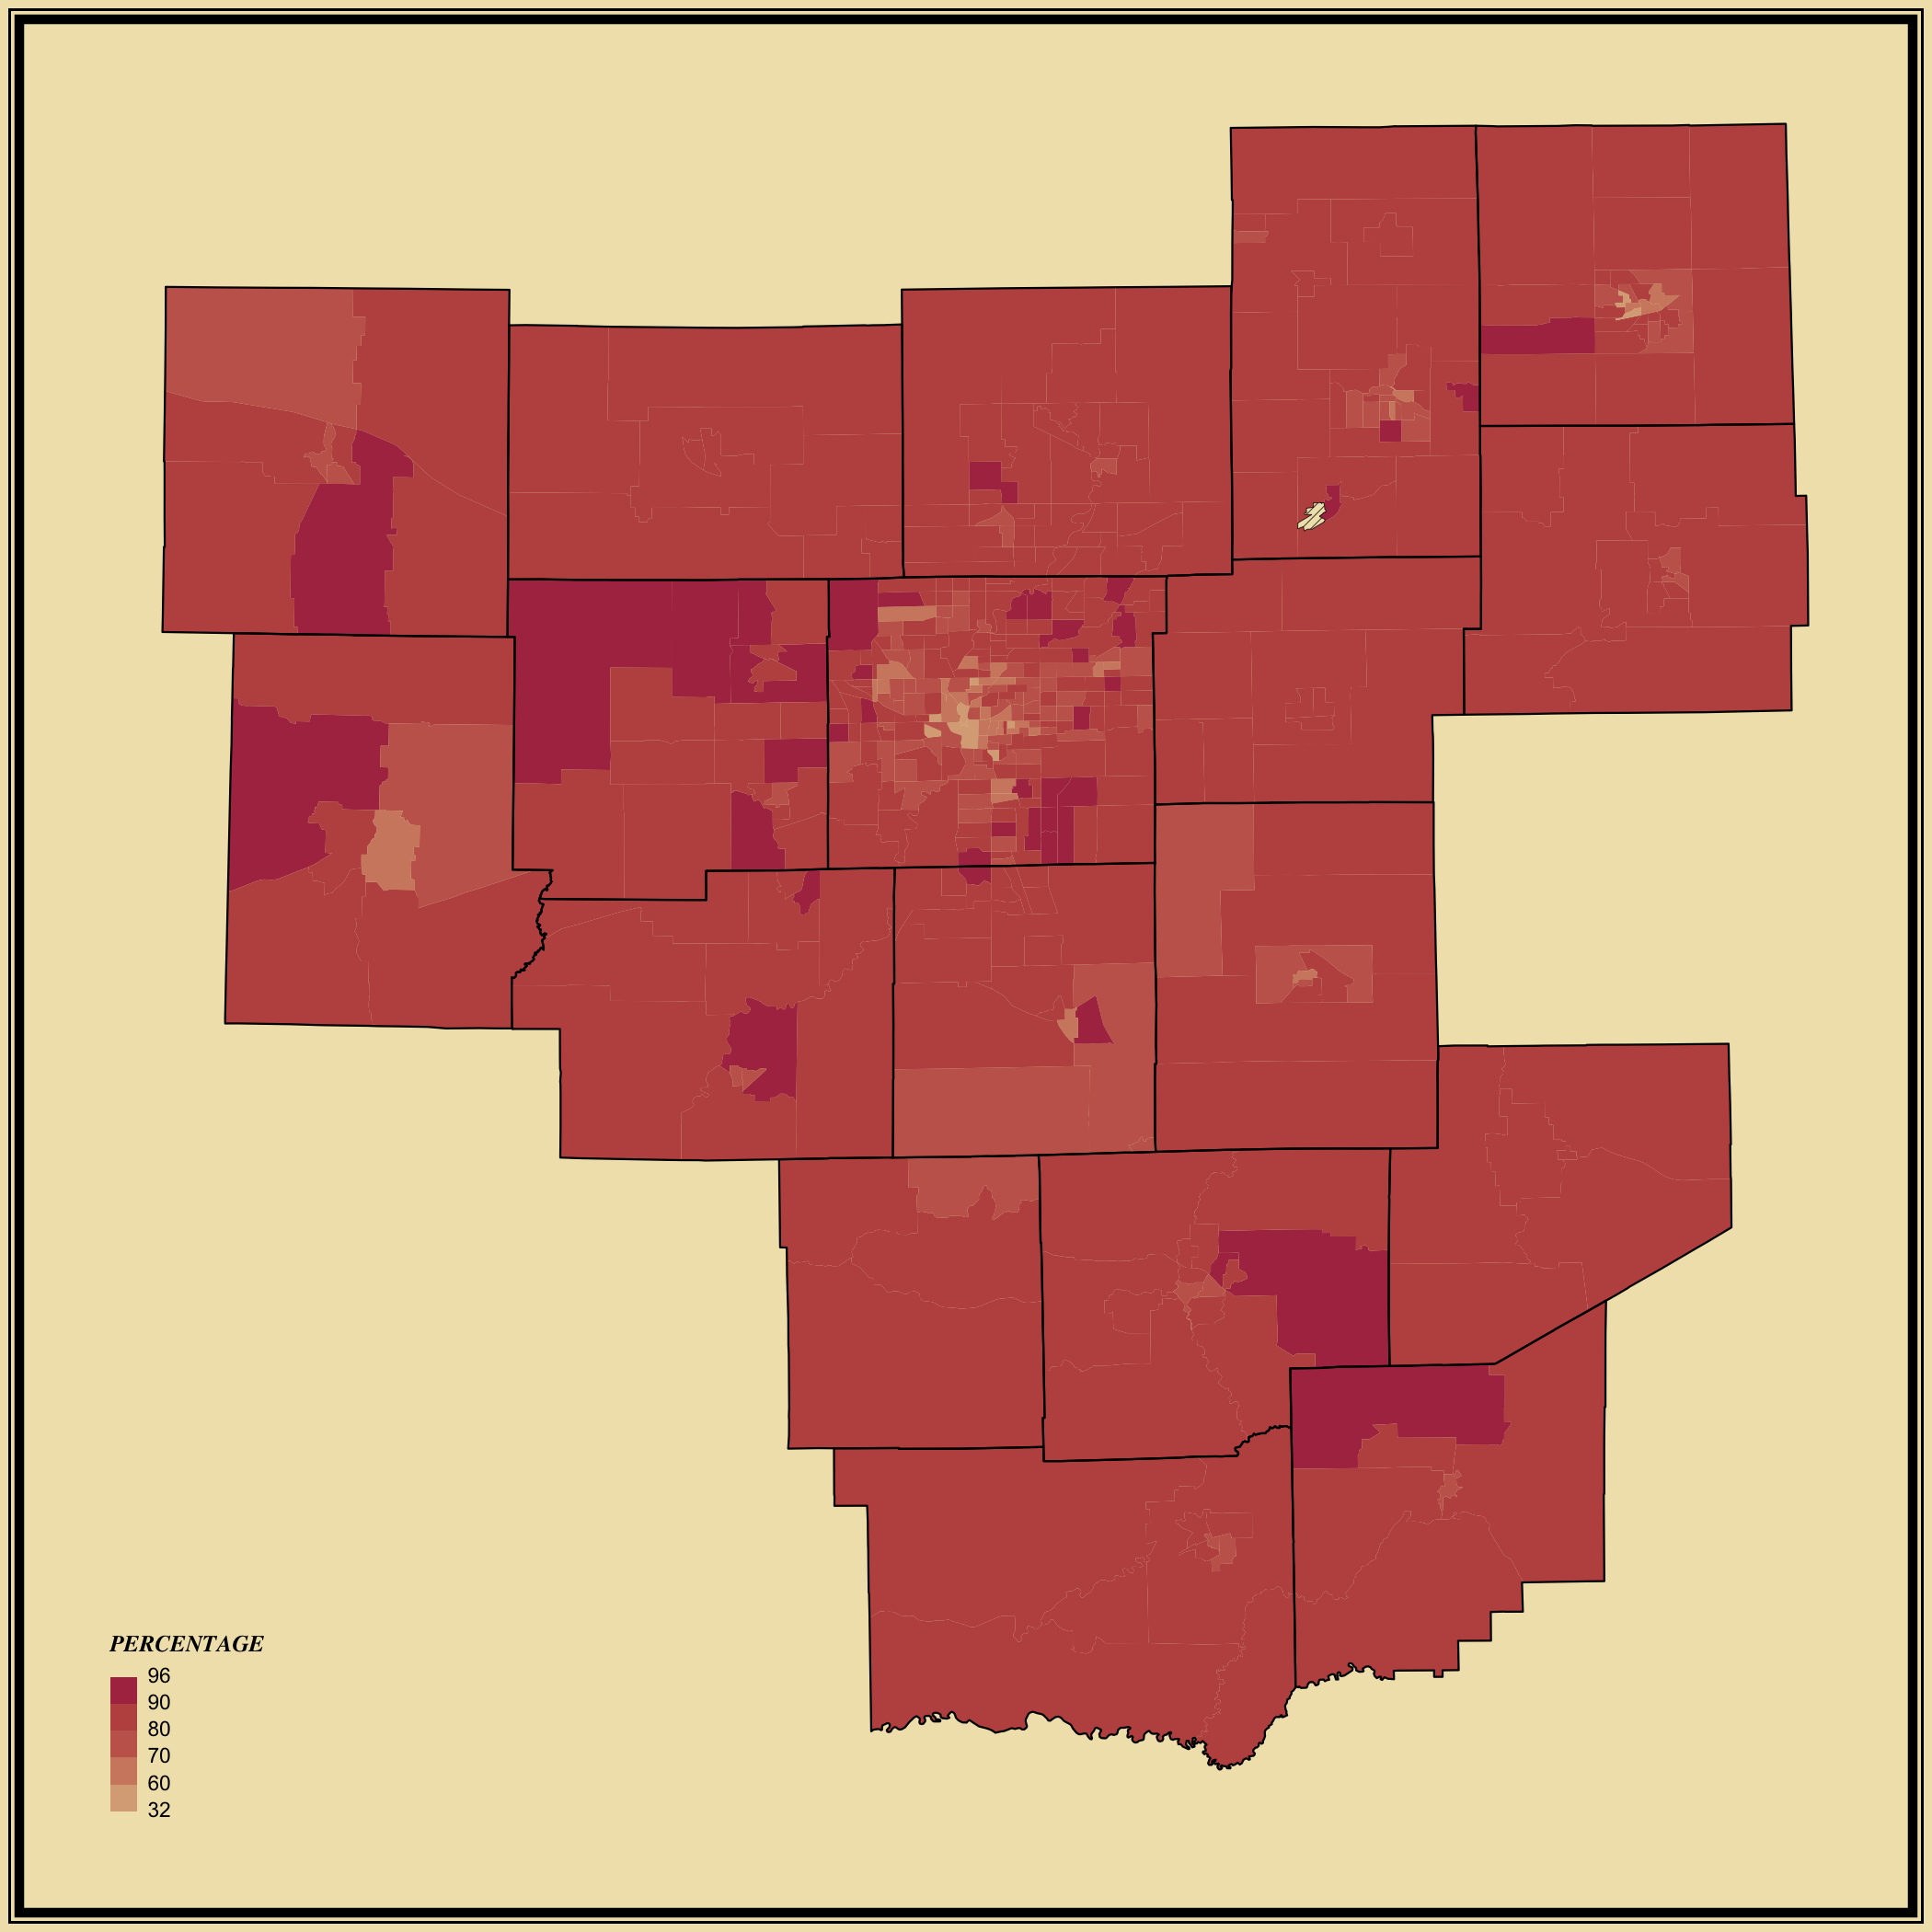
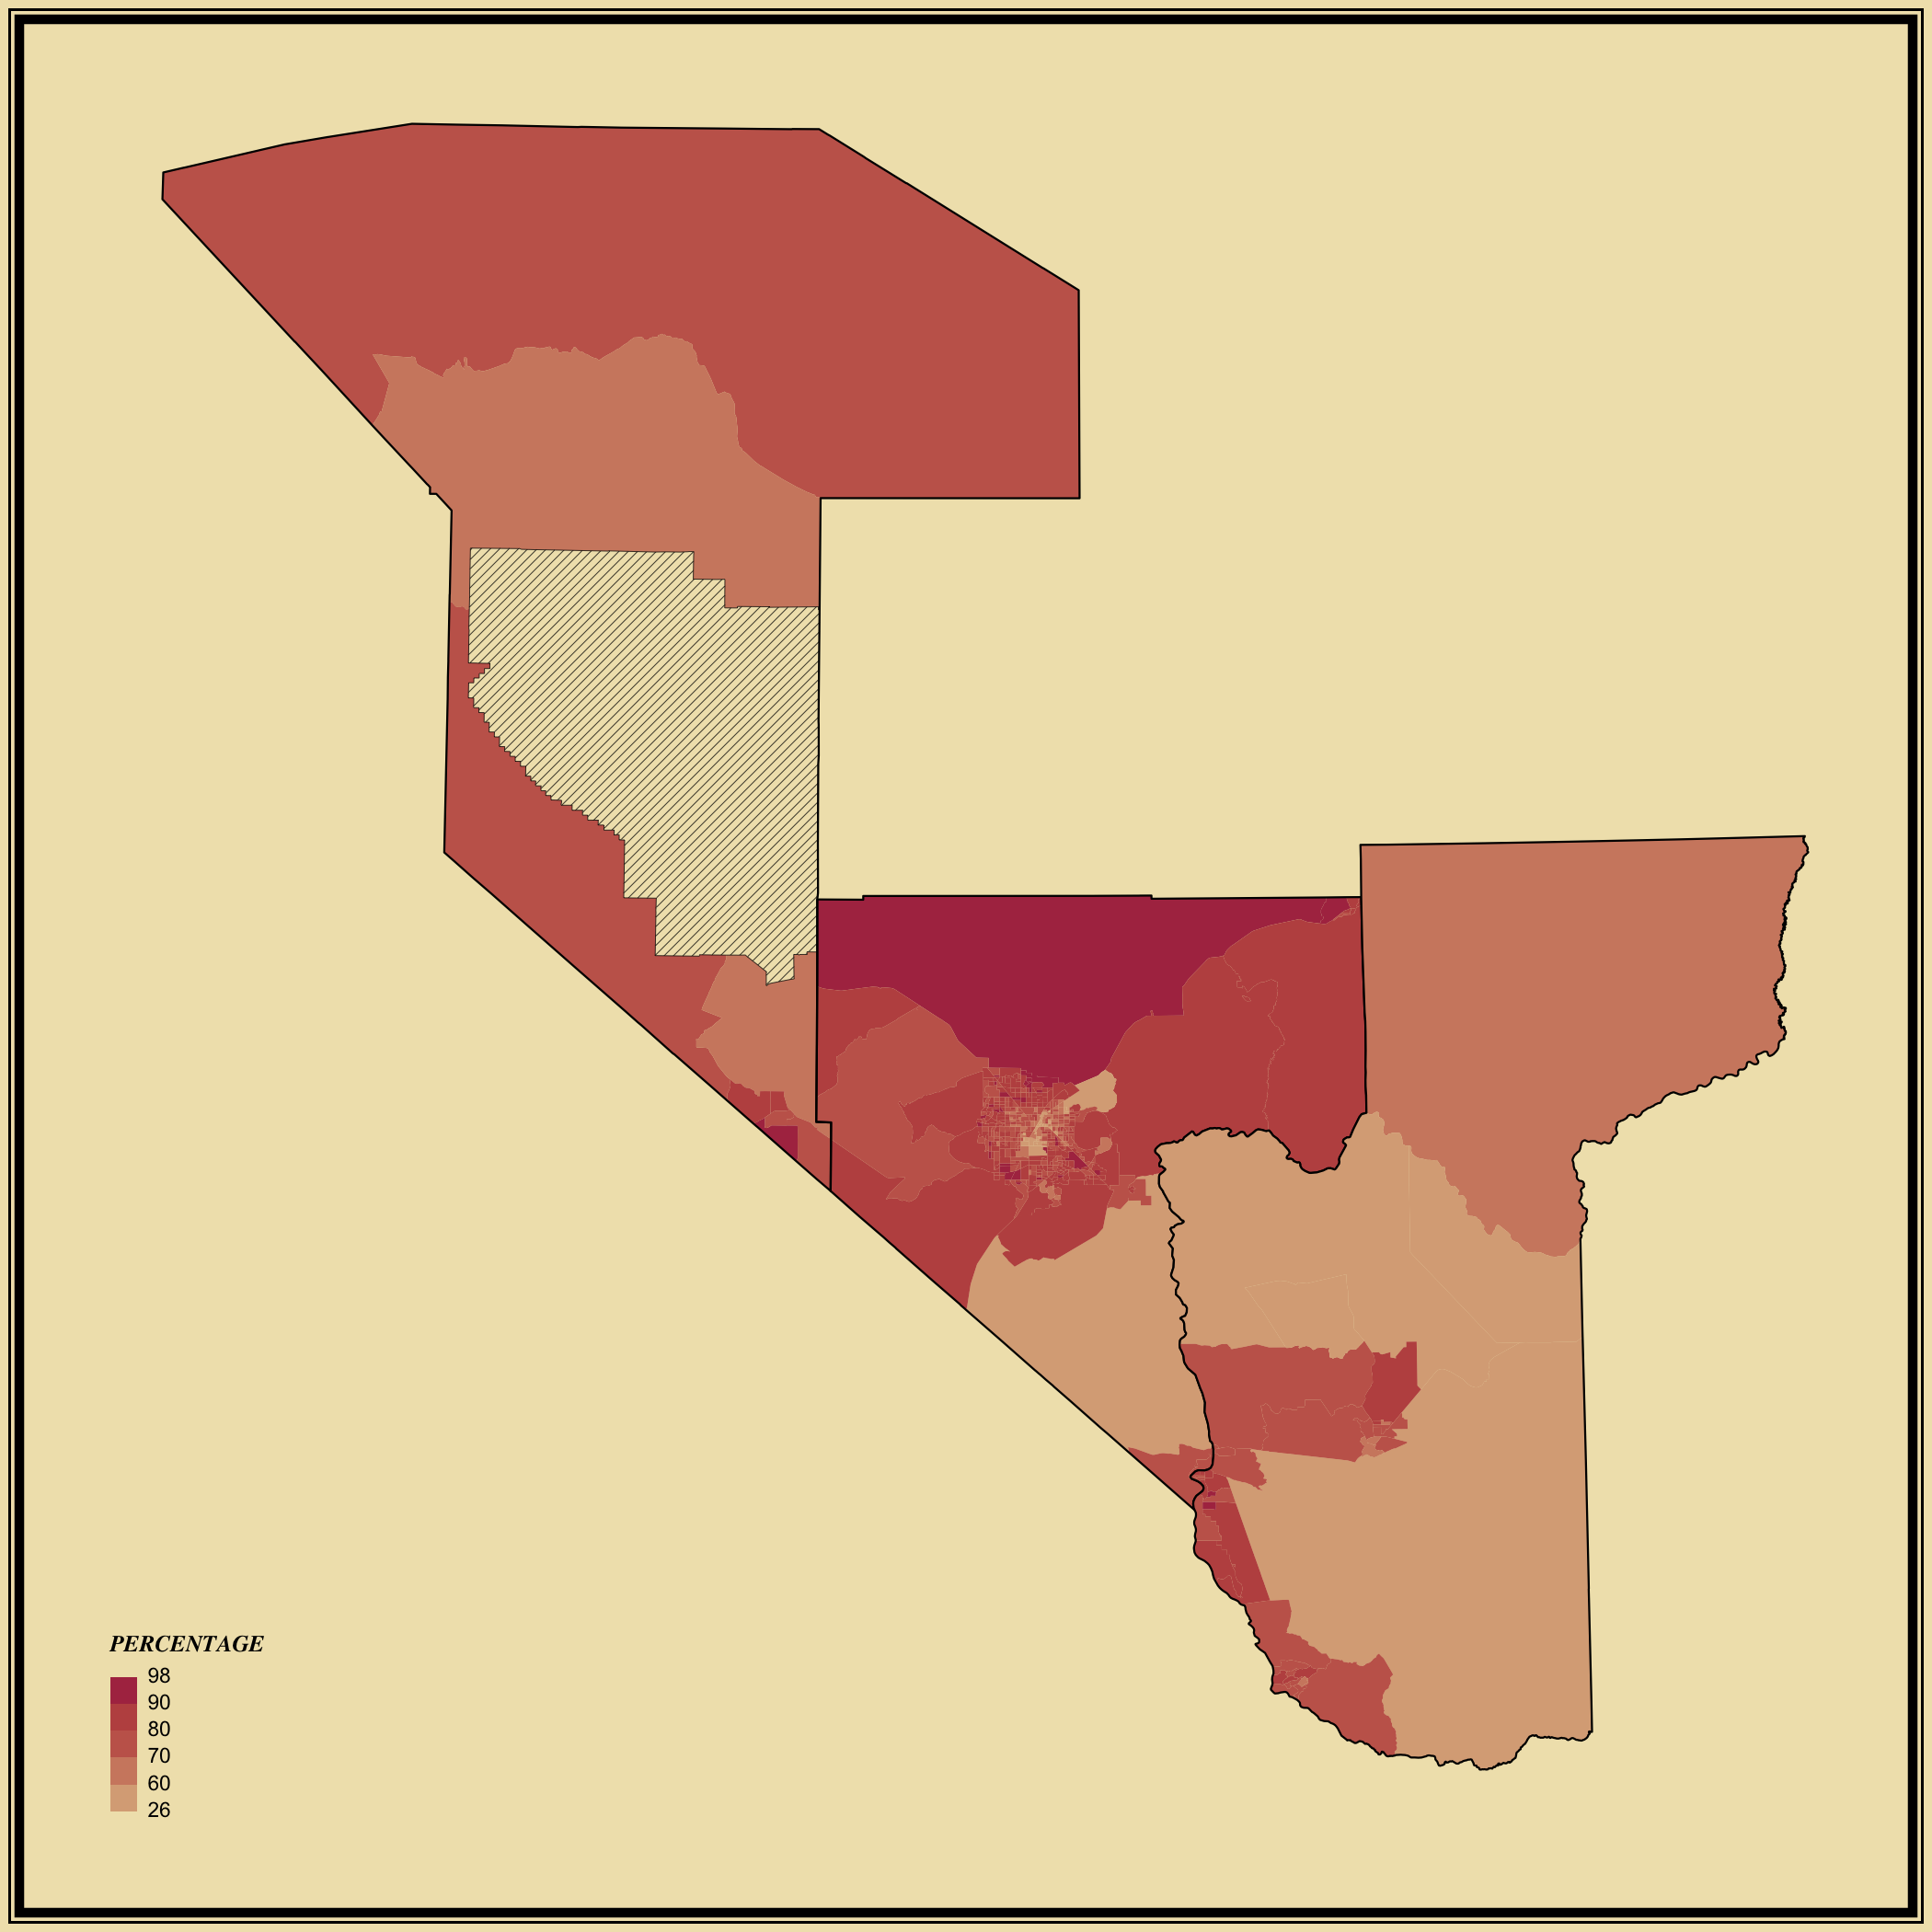
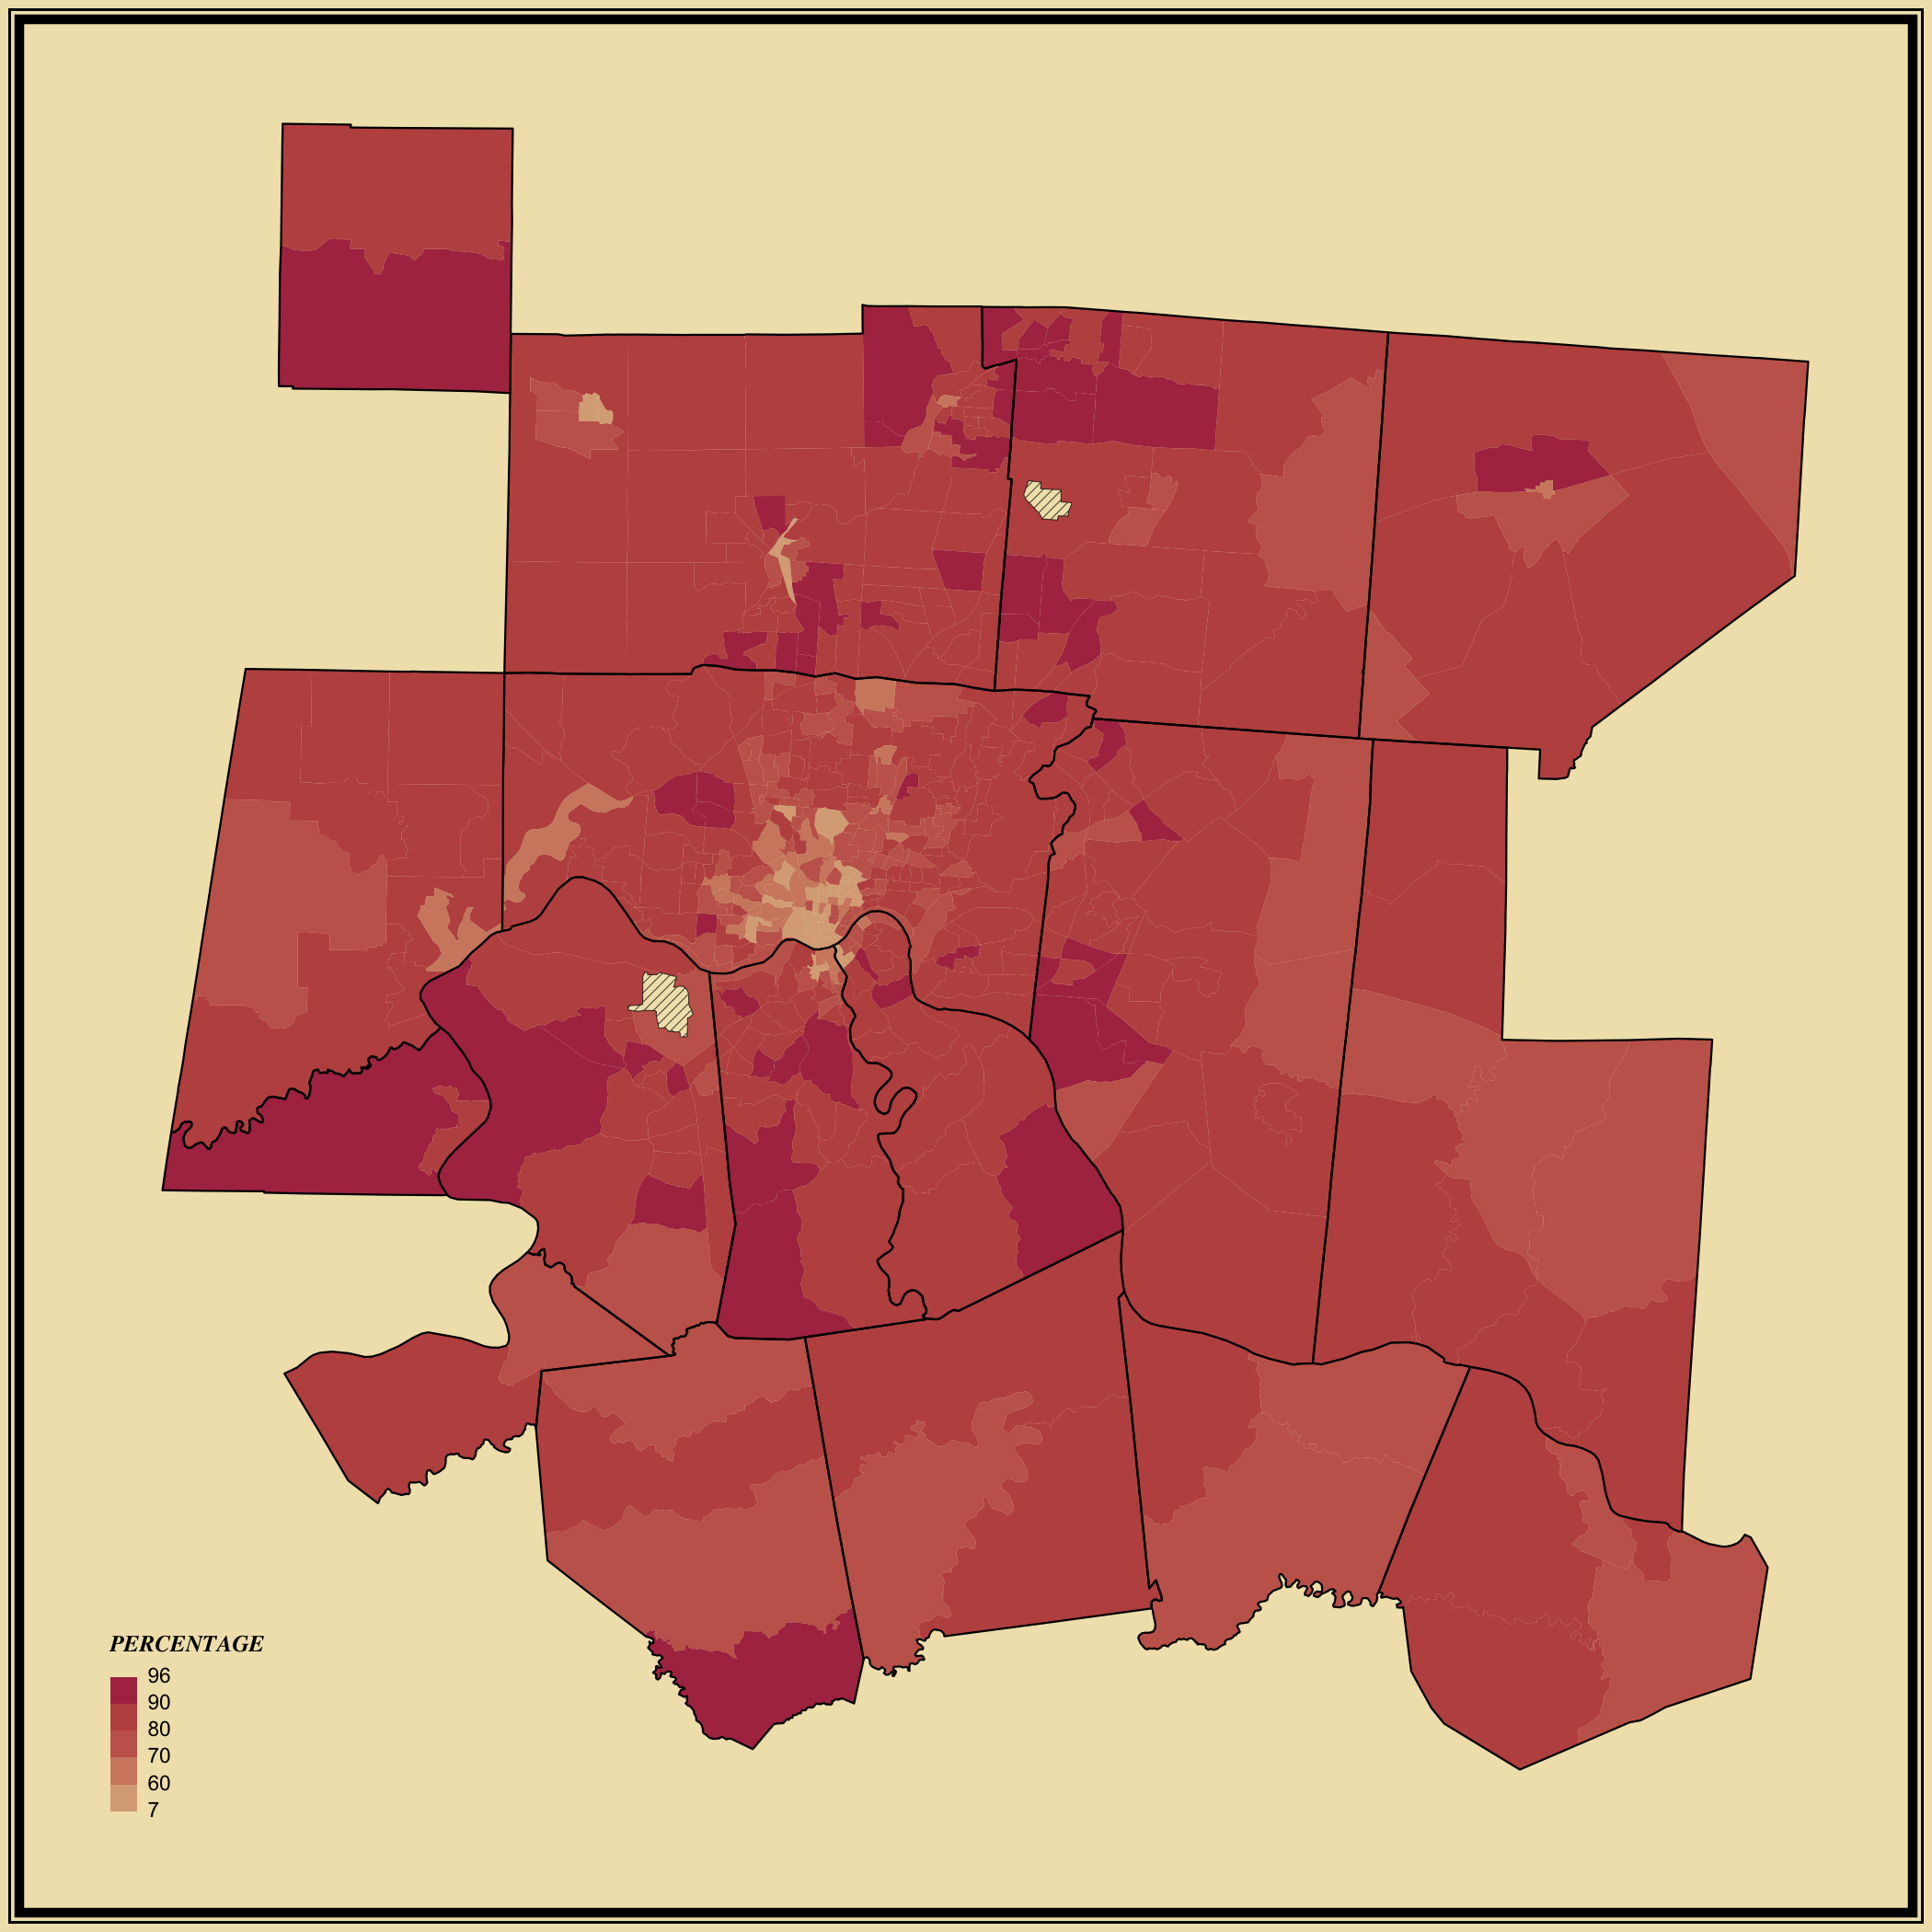
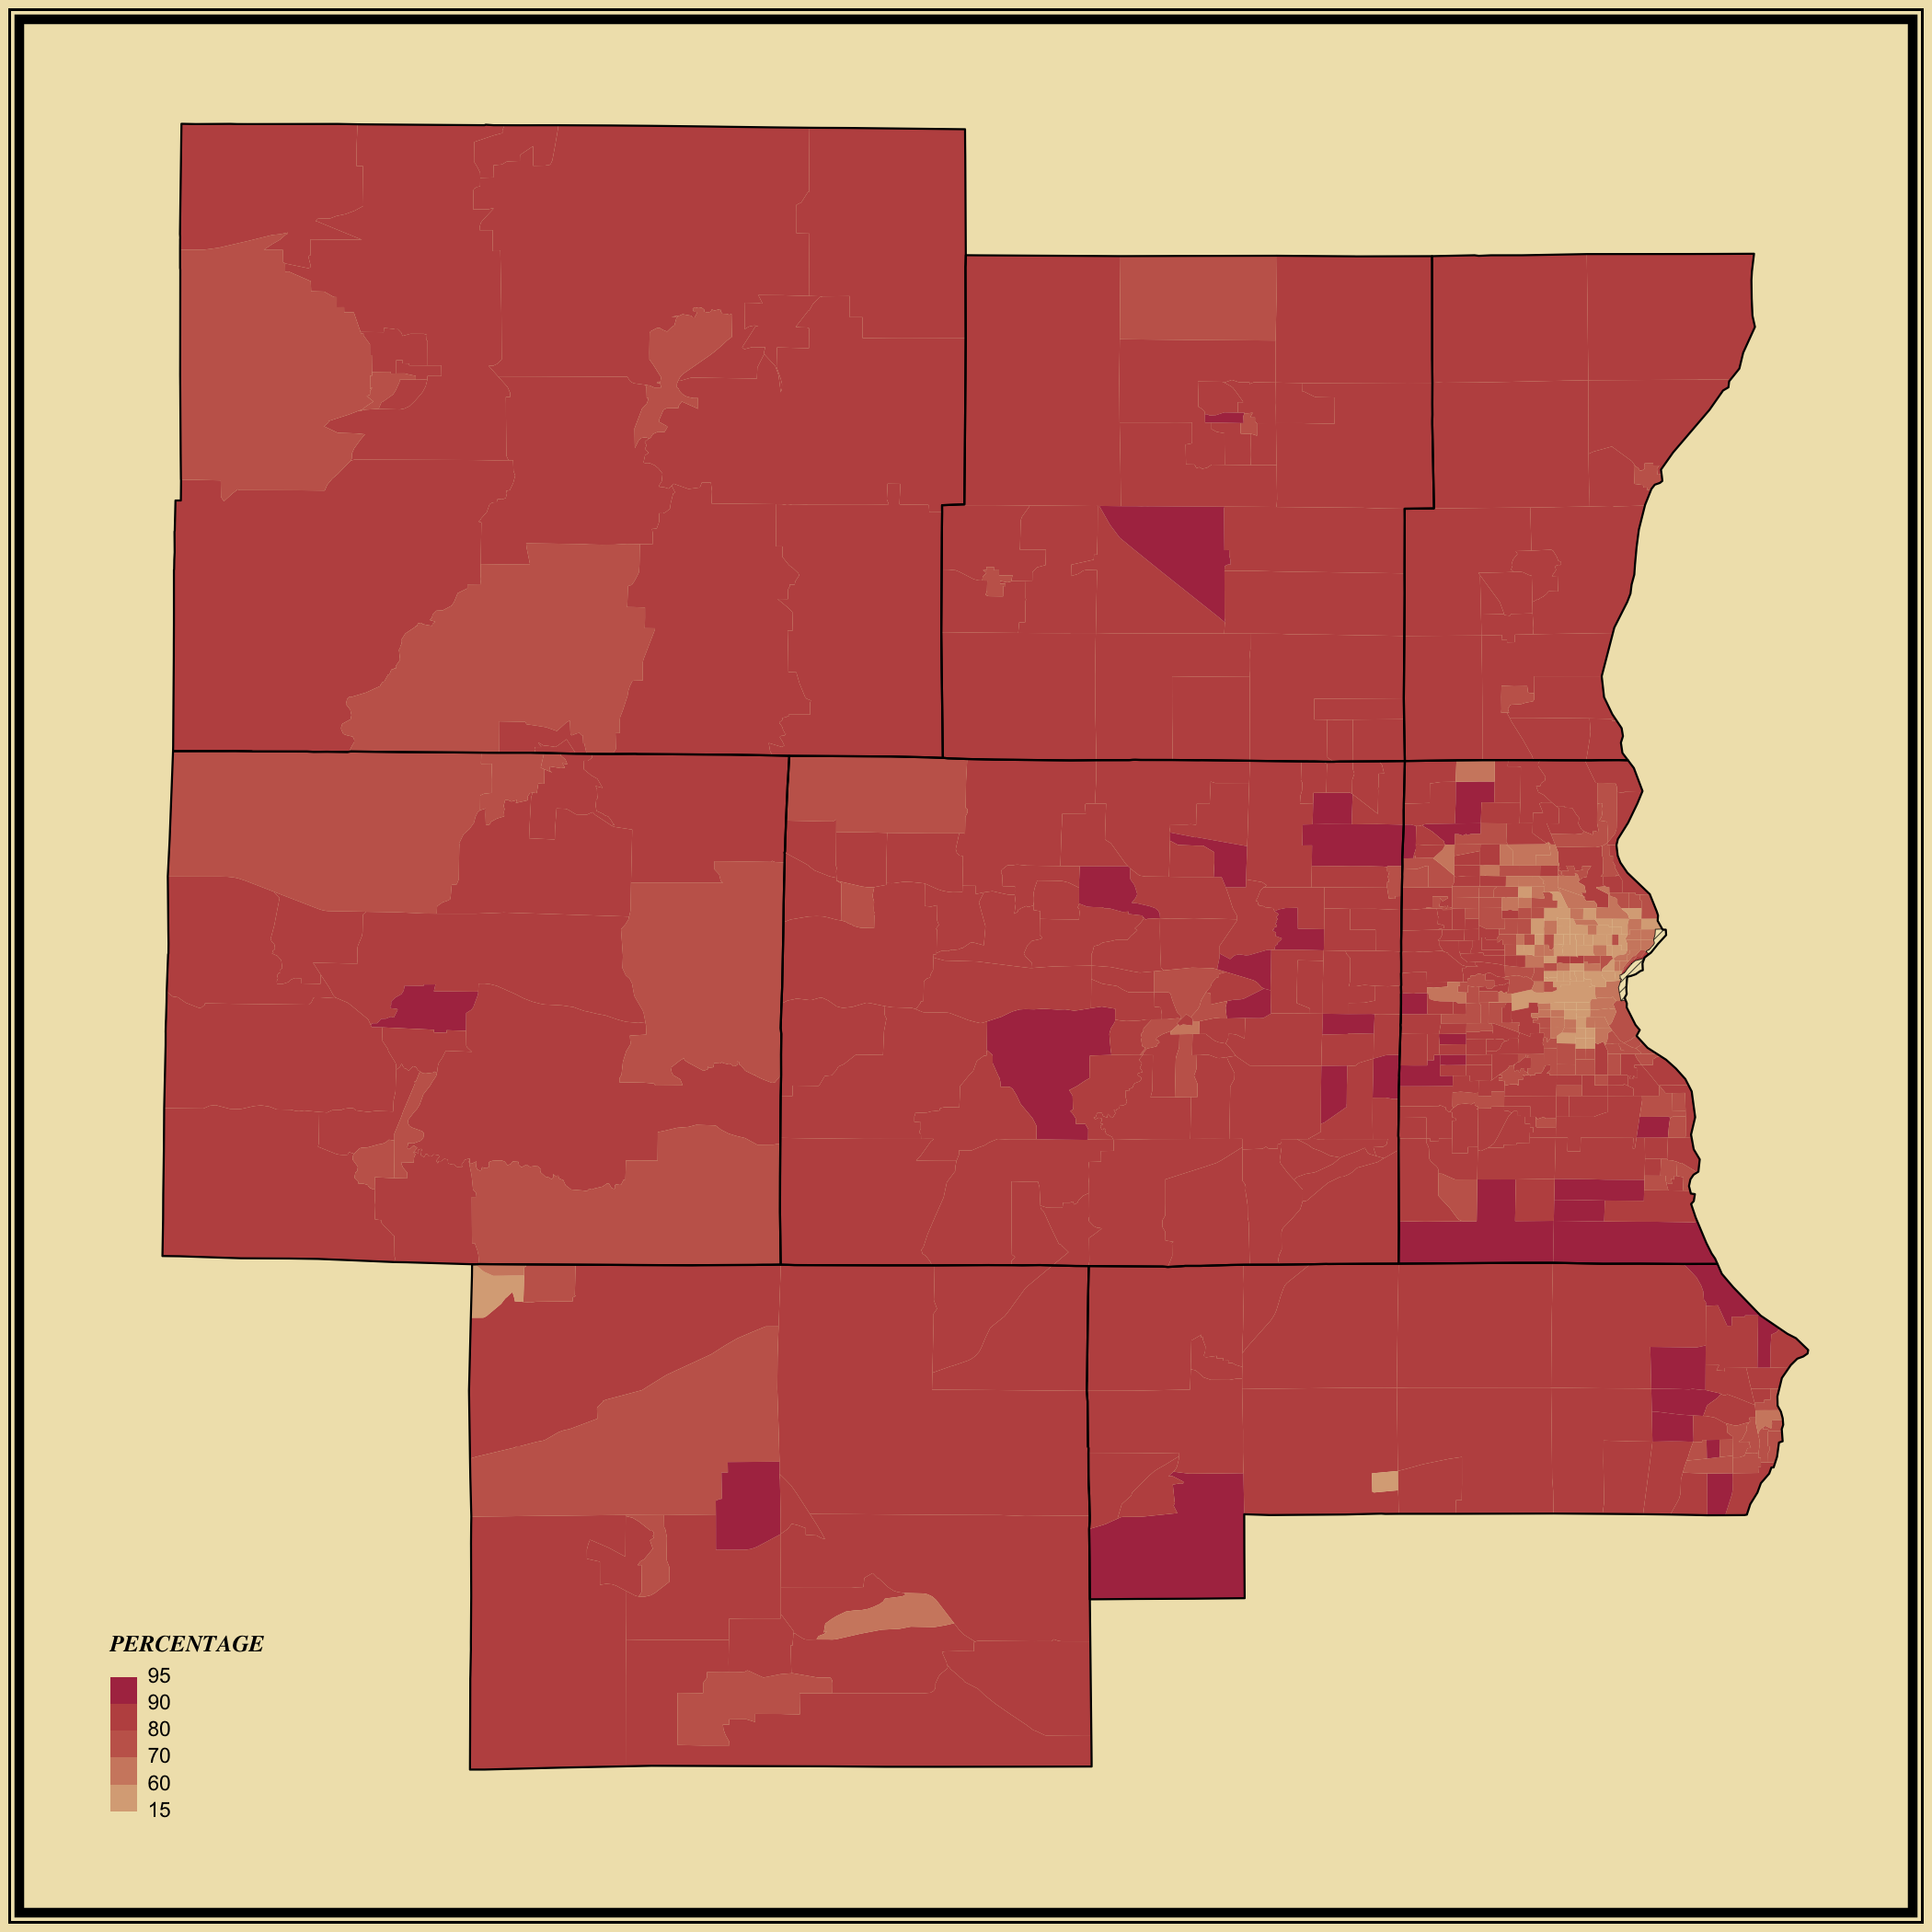
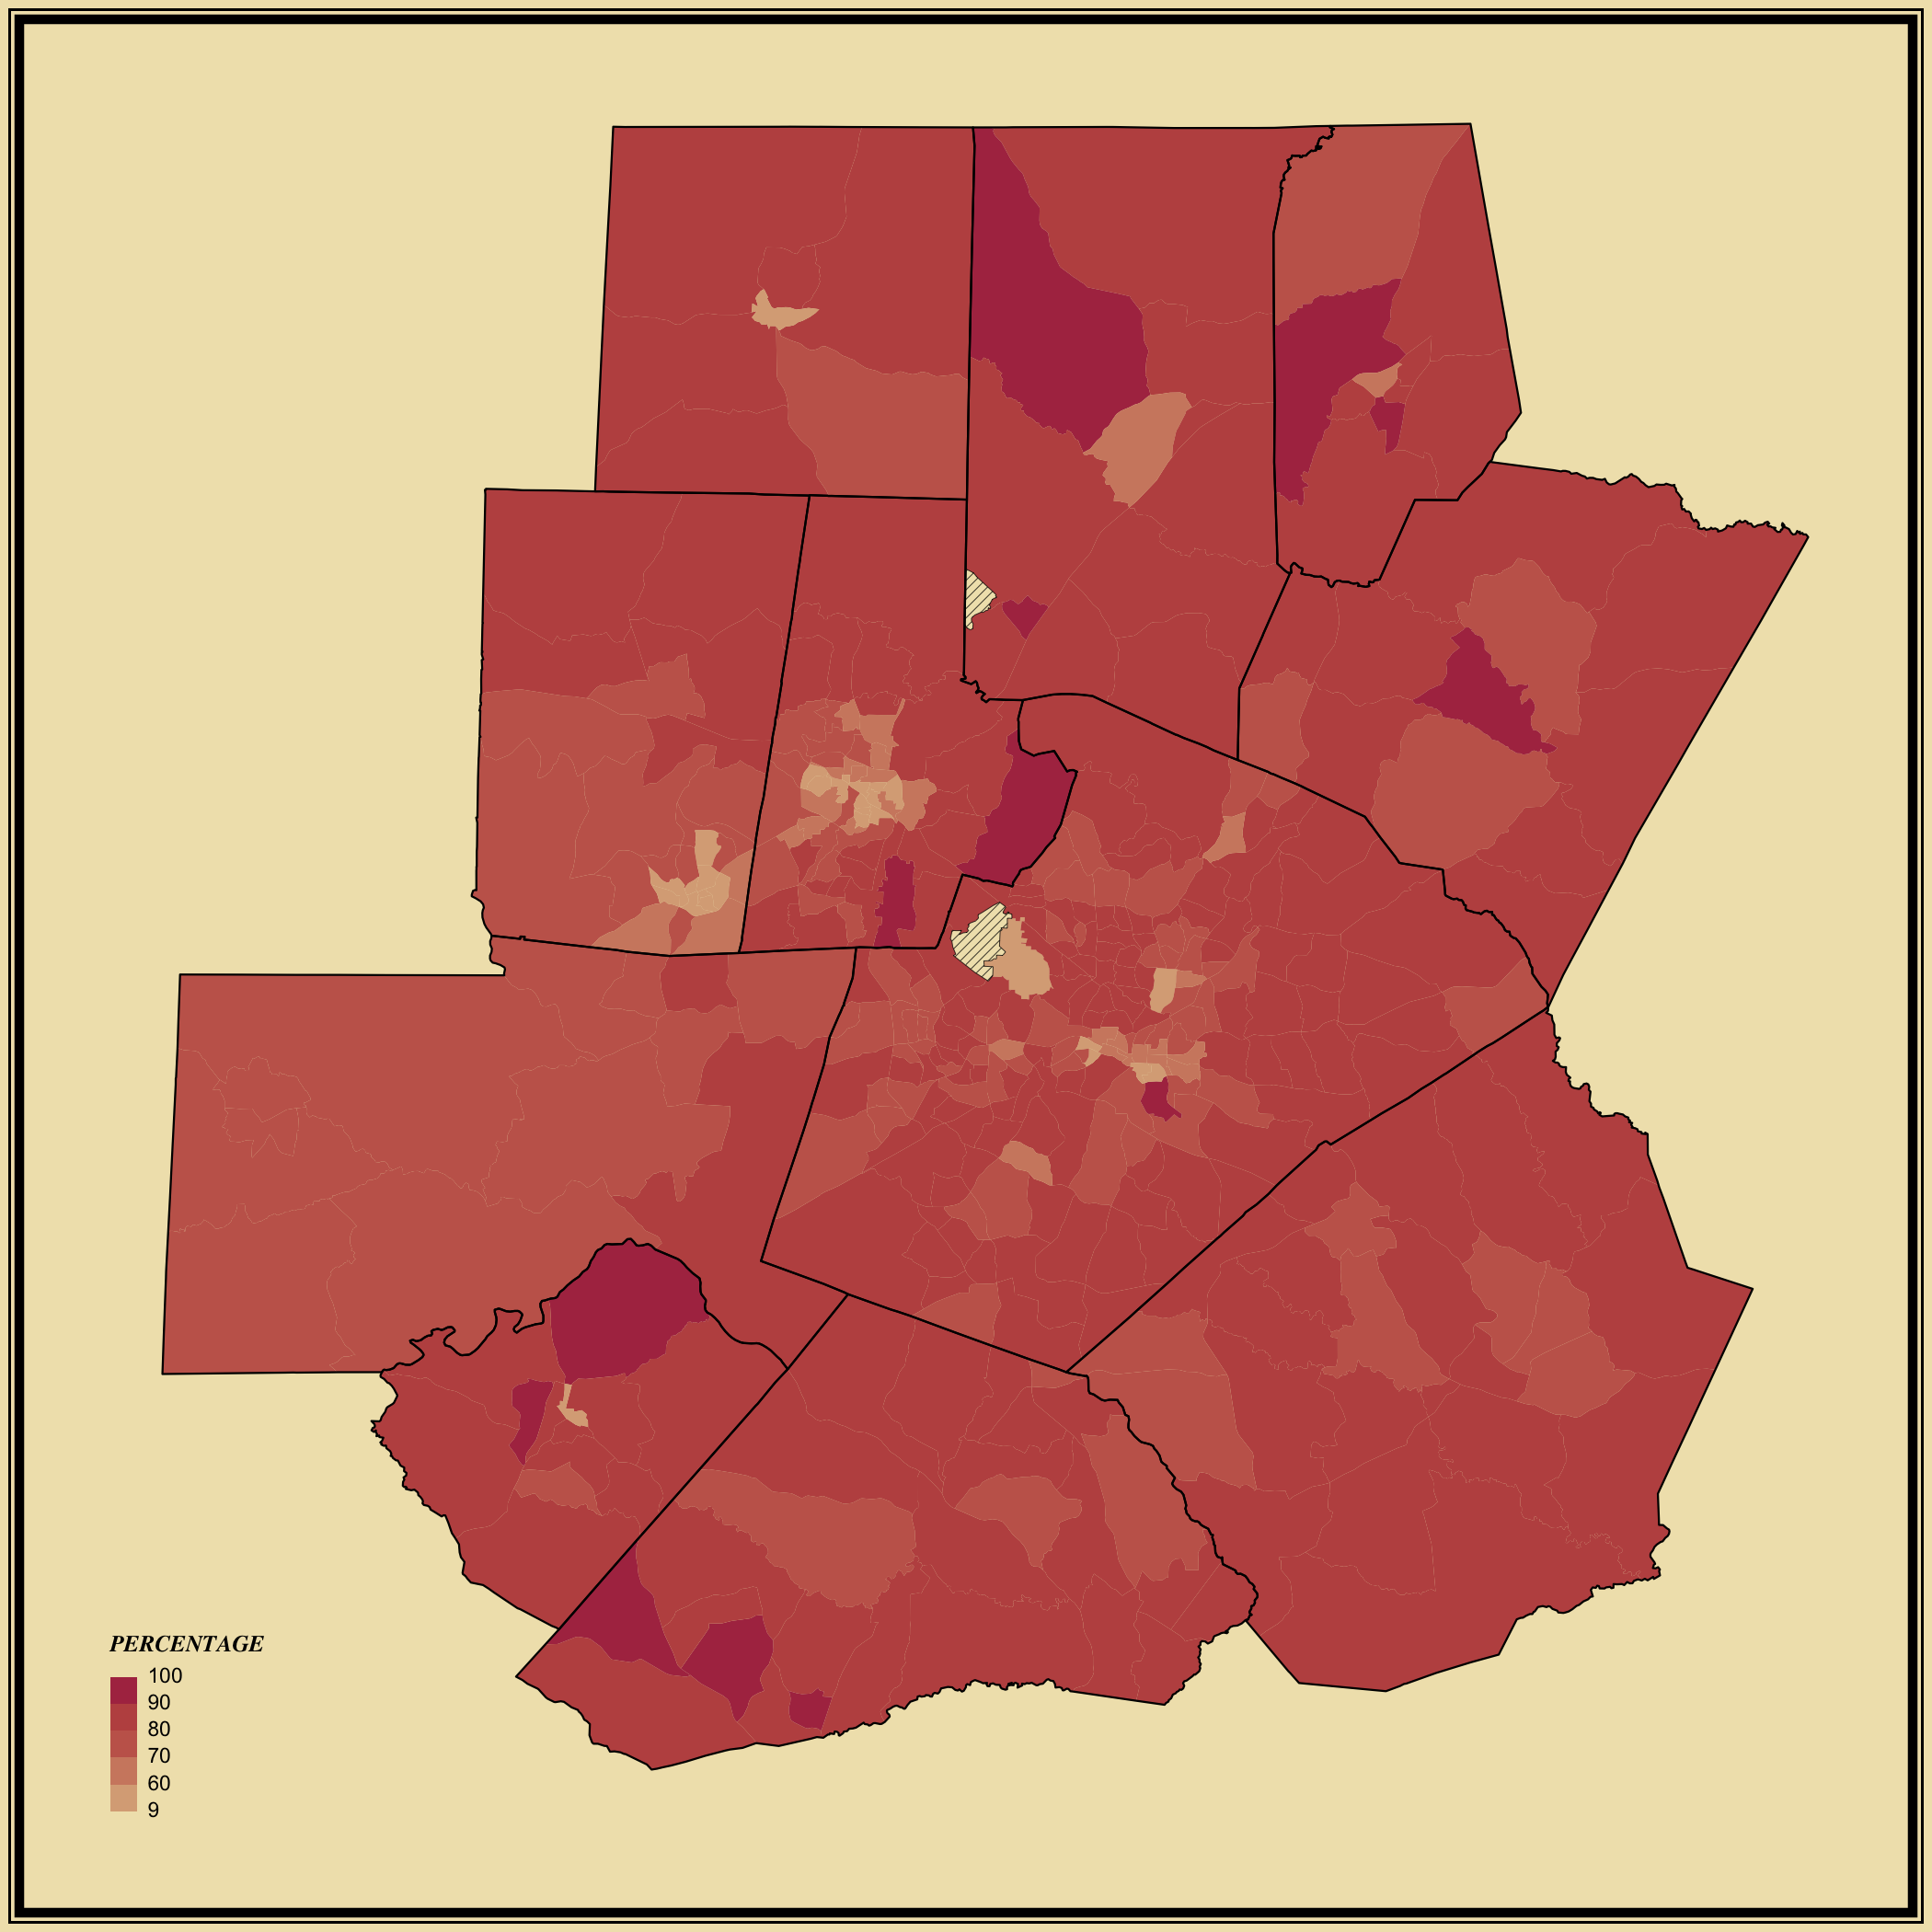
This set of choropleth maps shows the percentage of workers 16 years and over who drove alone to get to work. Darker shades represent higher values.
Most workers drive alone in their commute. However, in some city centers where public and other forms of transportation are available, the percentage of lone drivers is close to zero. Contrast this set with the percentage of workers who take public transportation.


