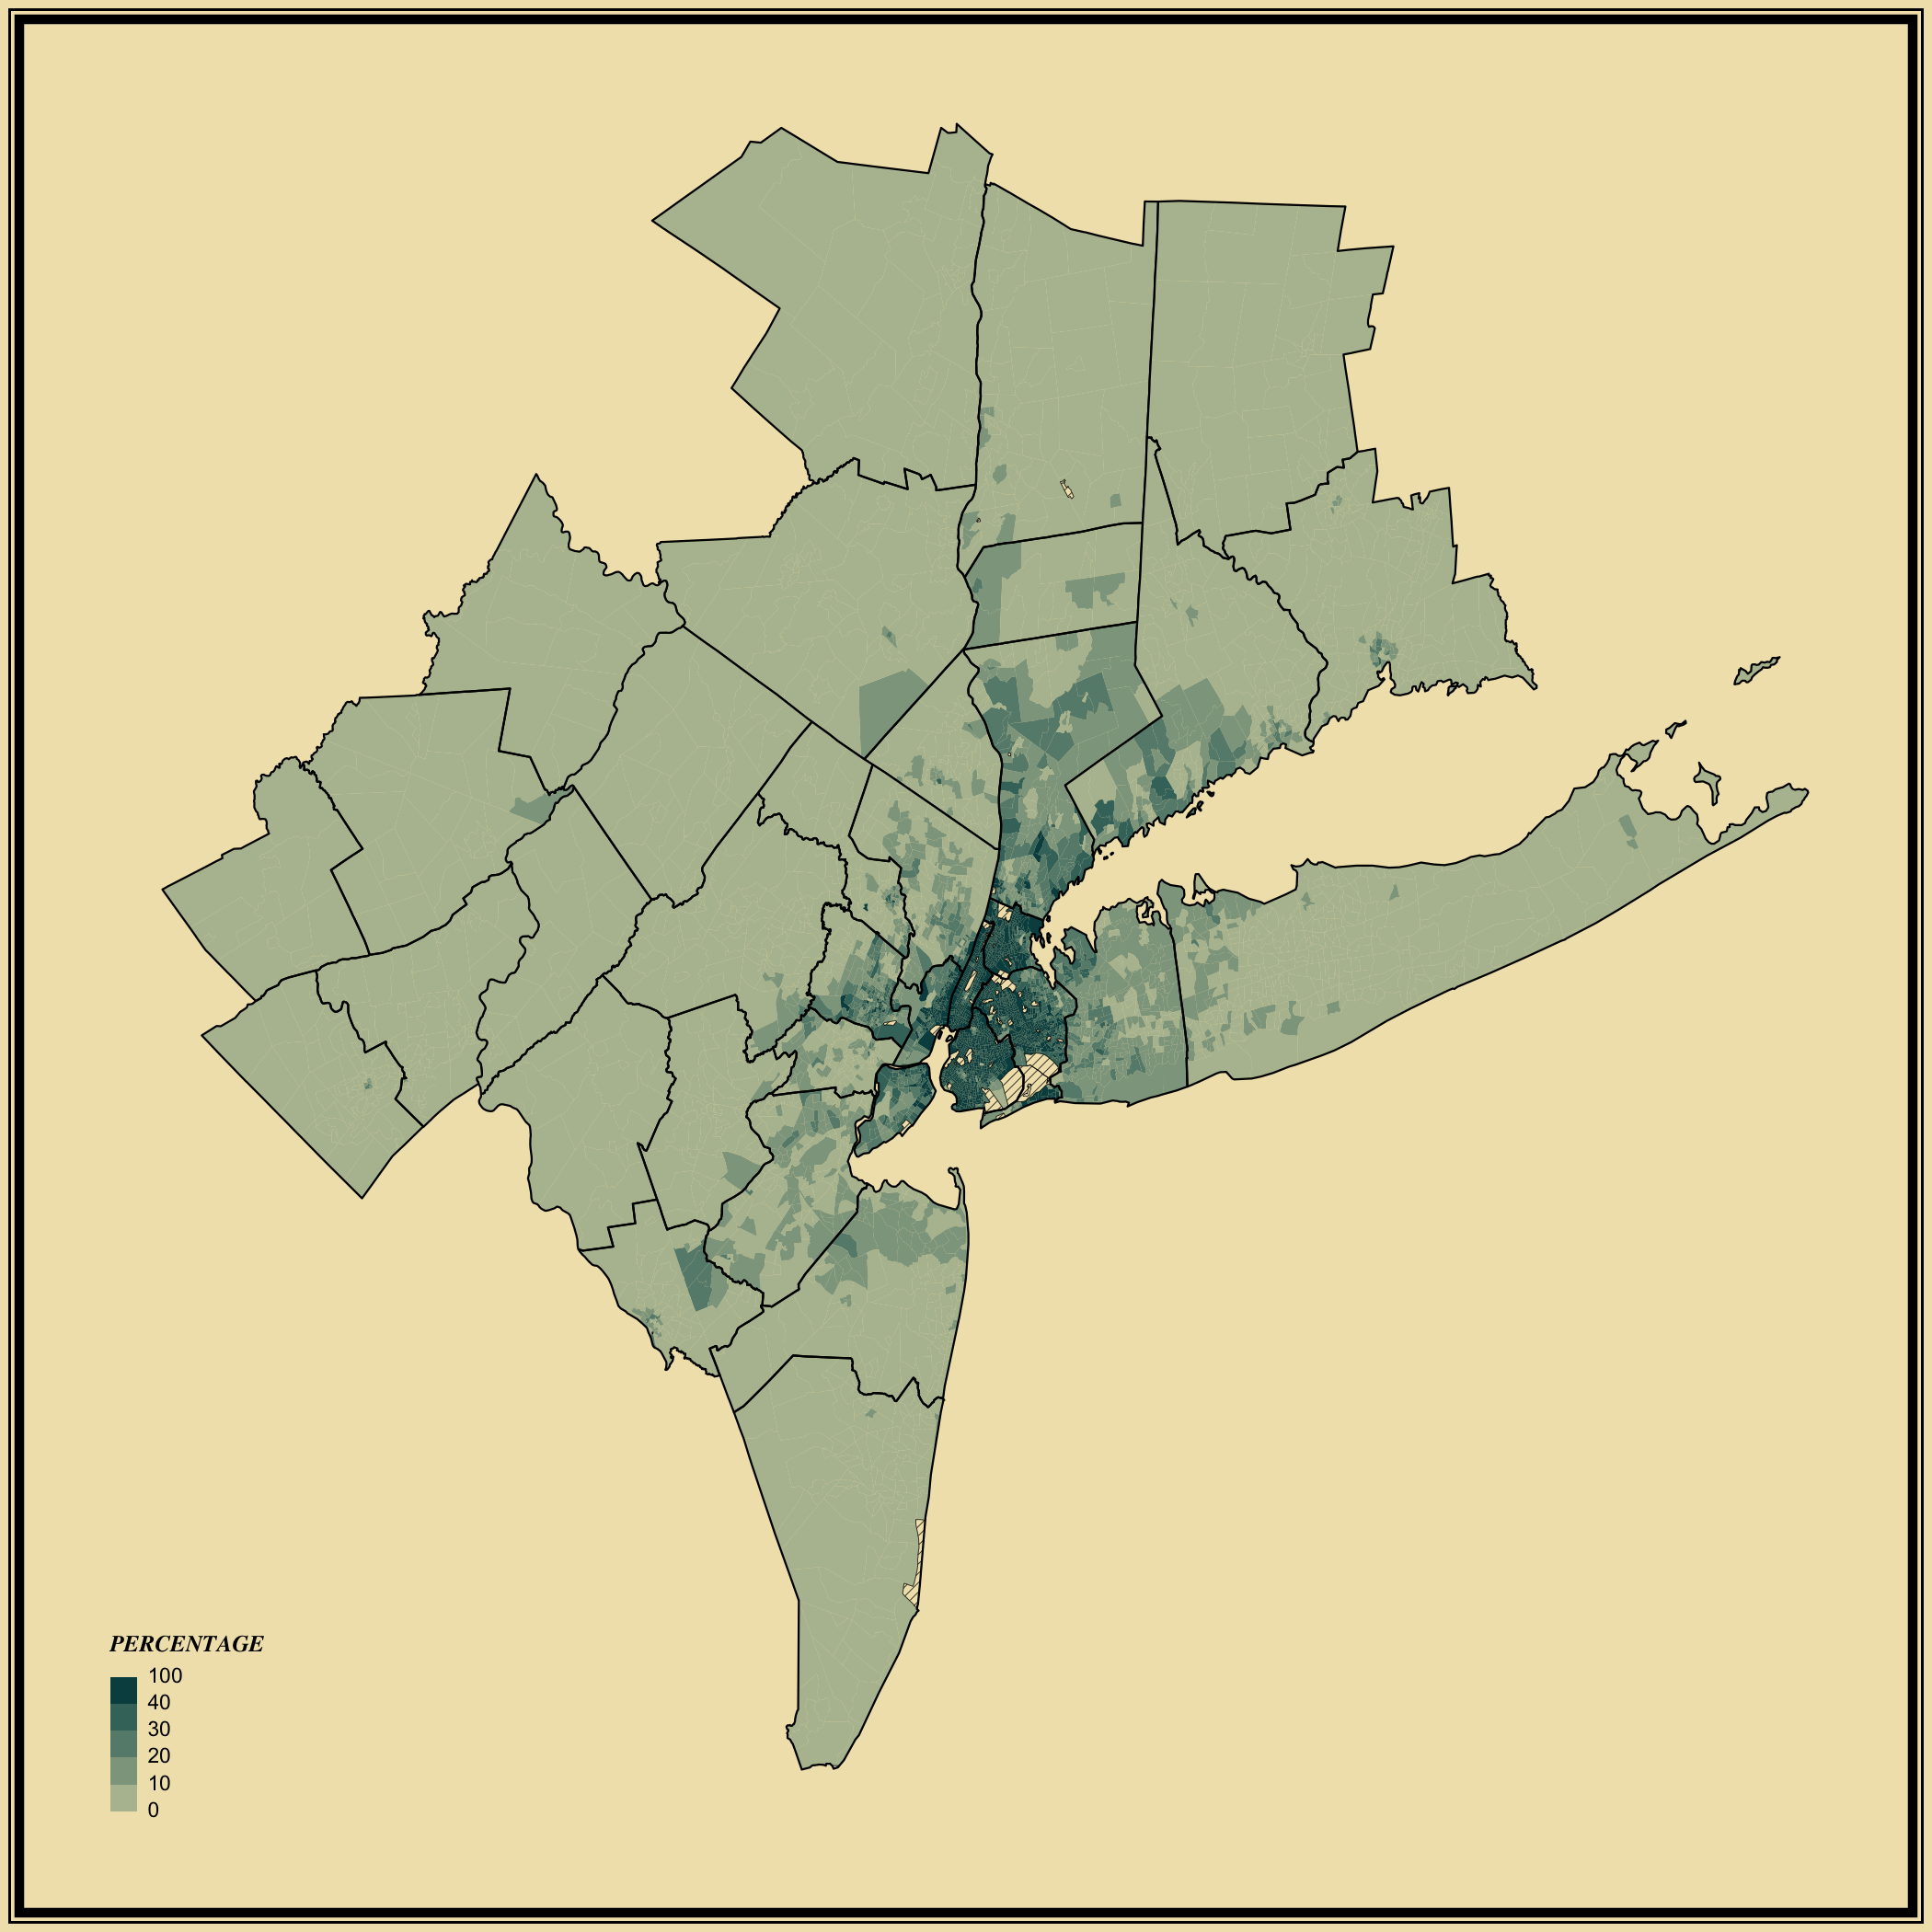

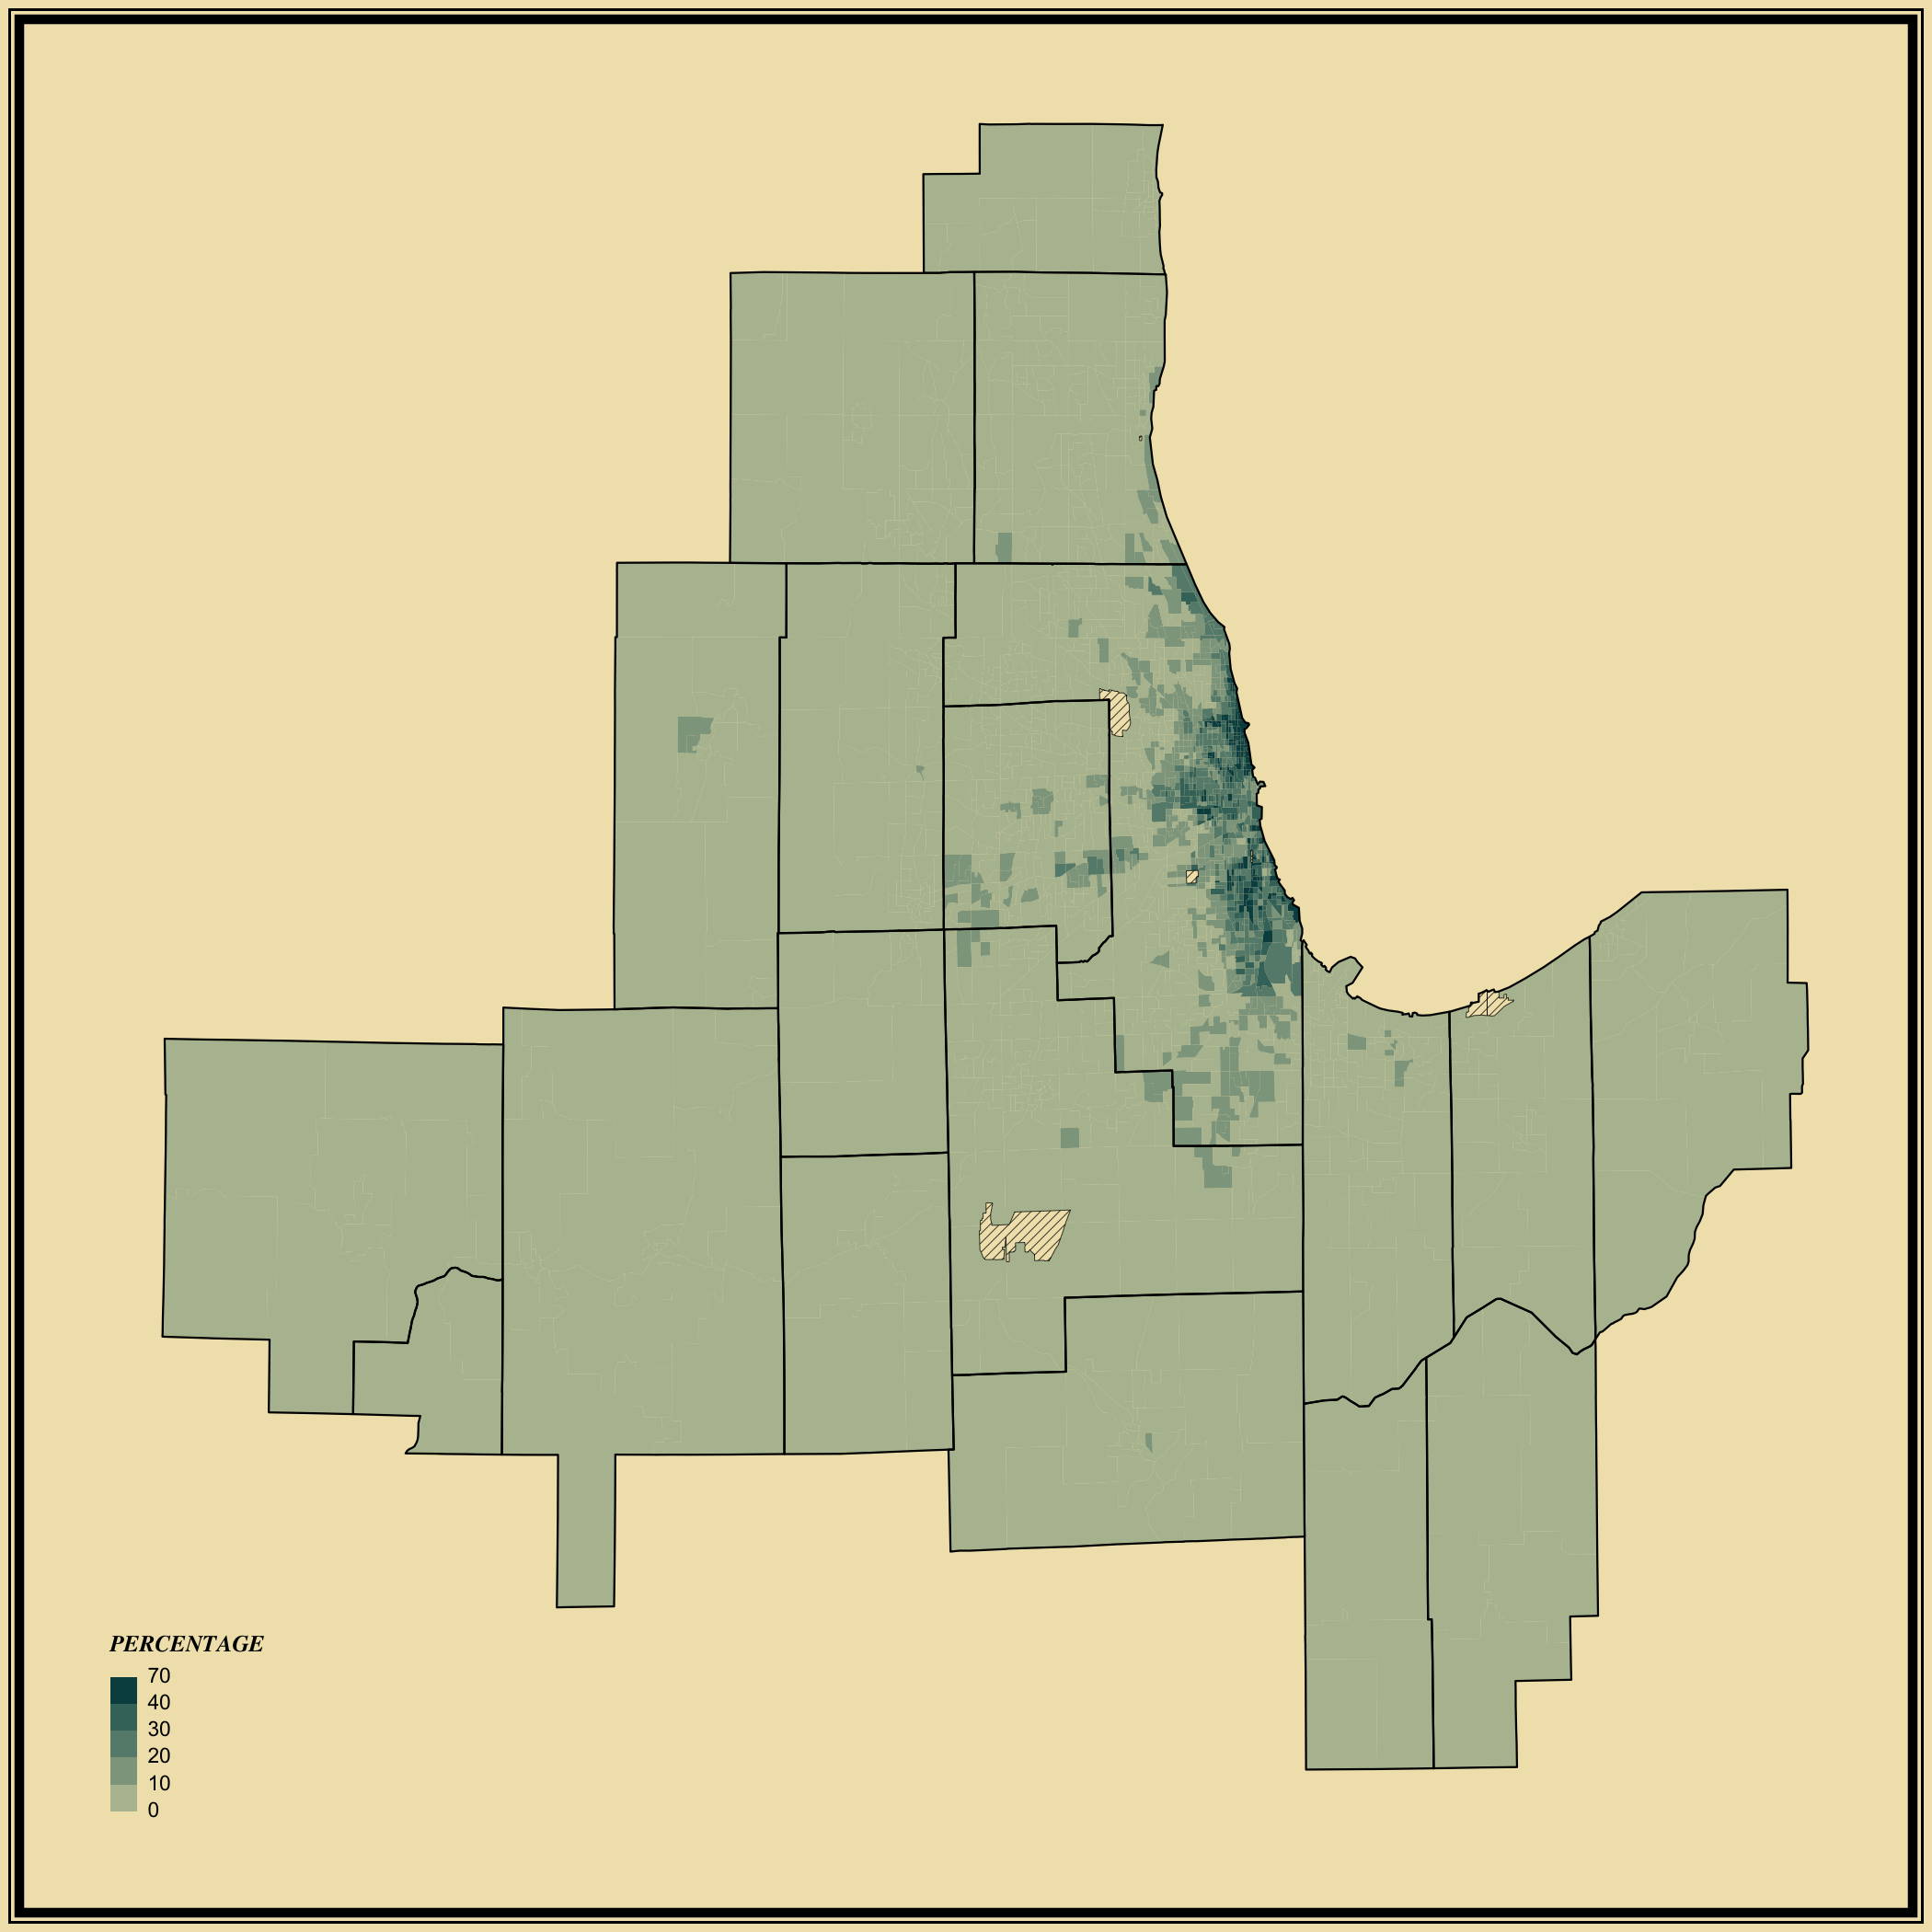
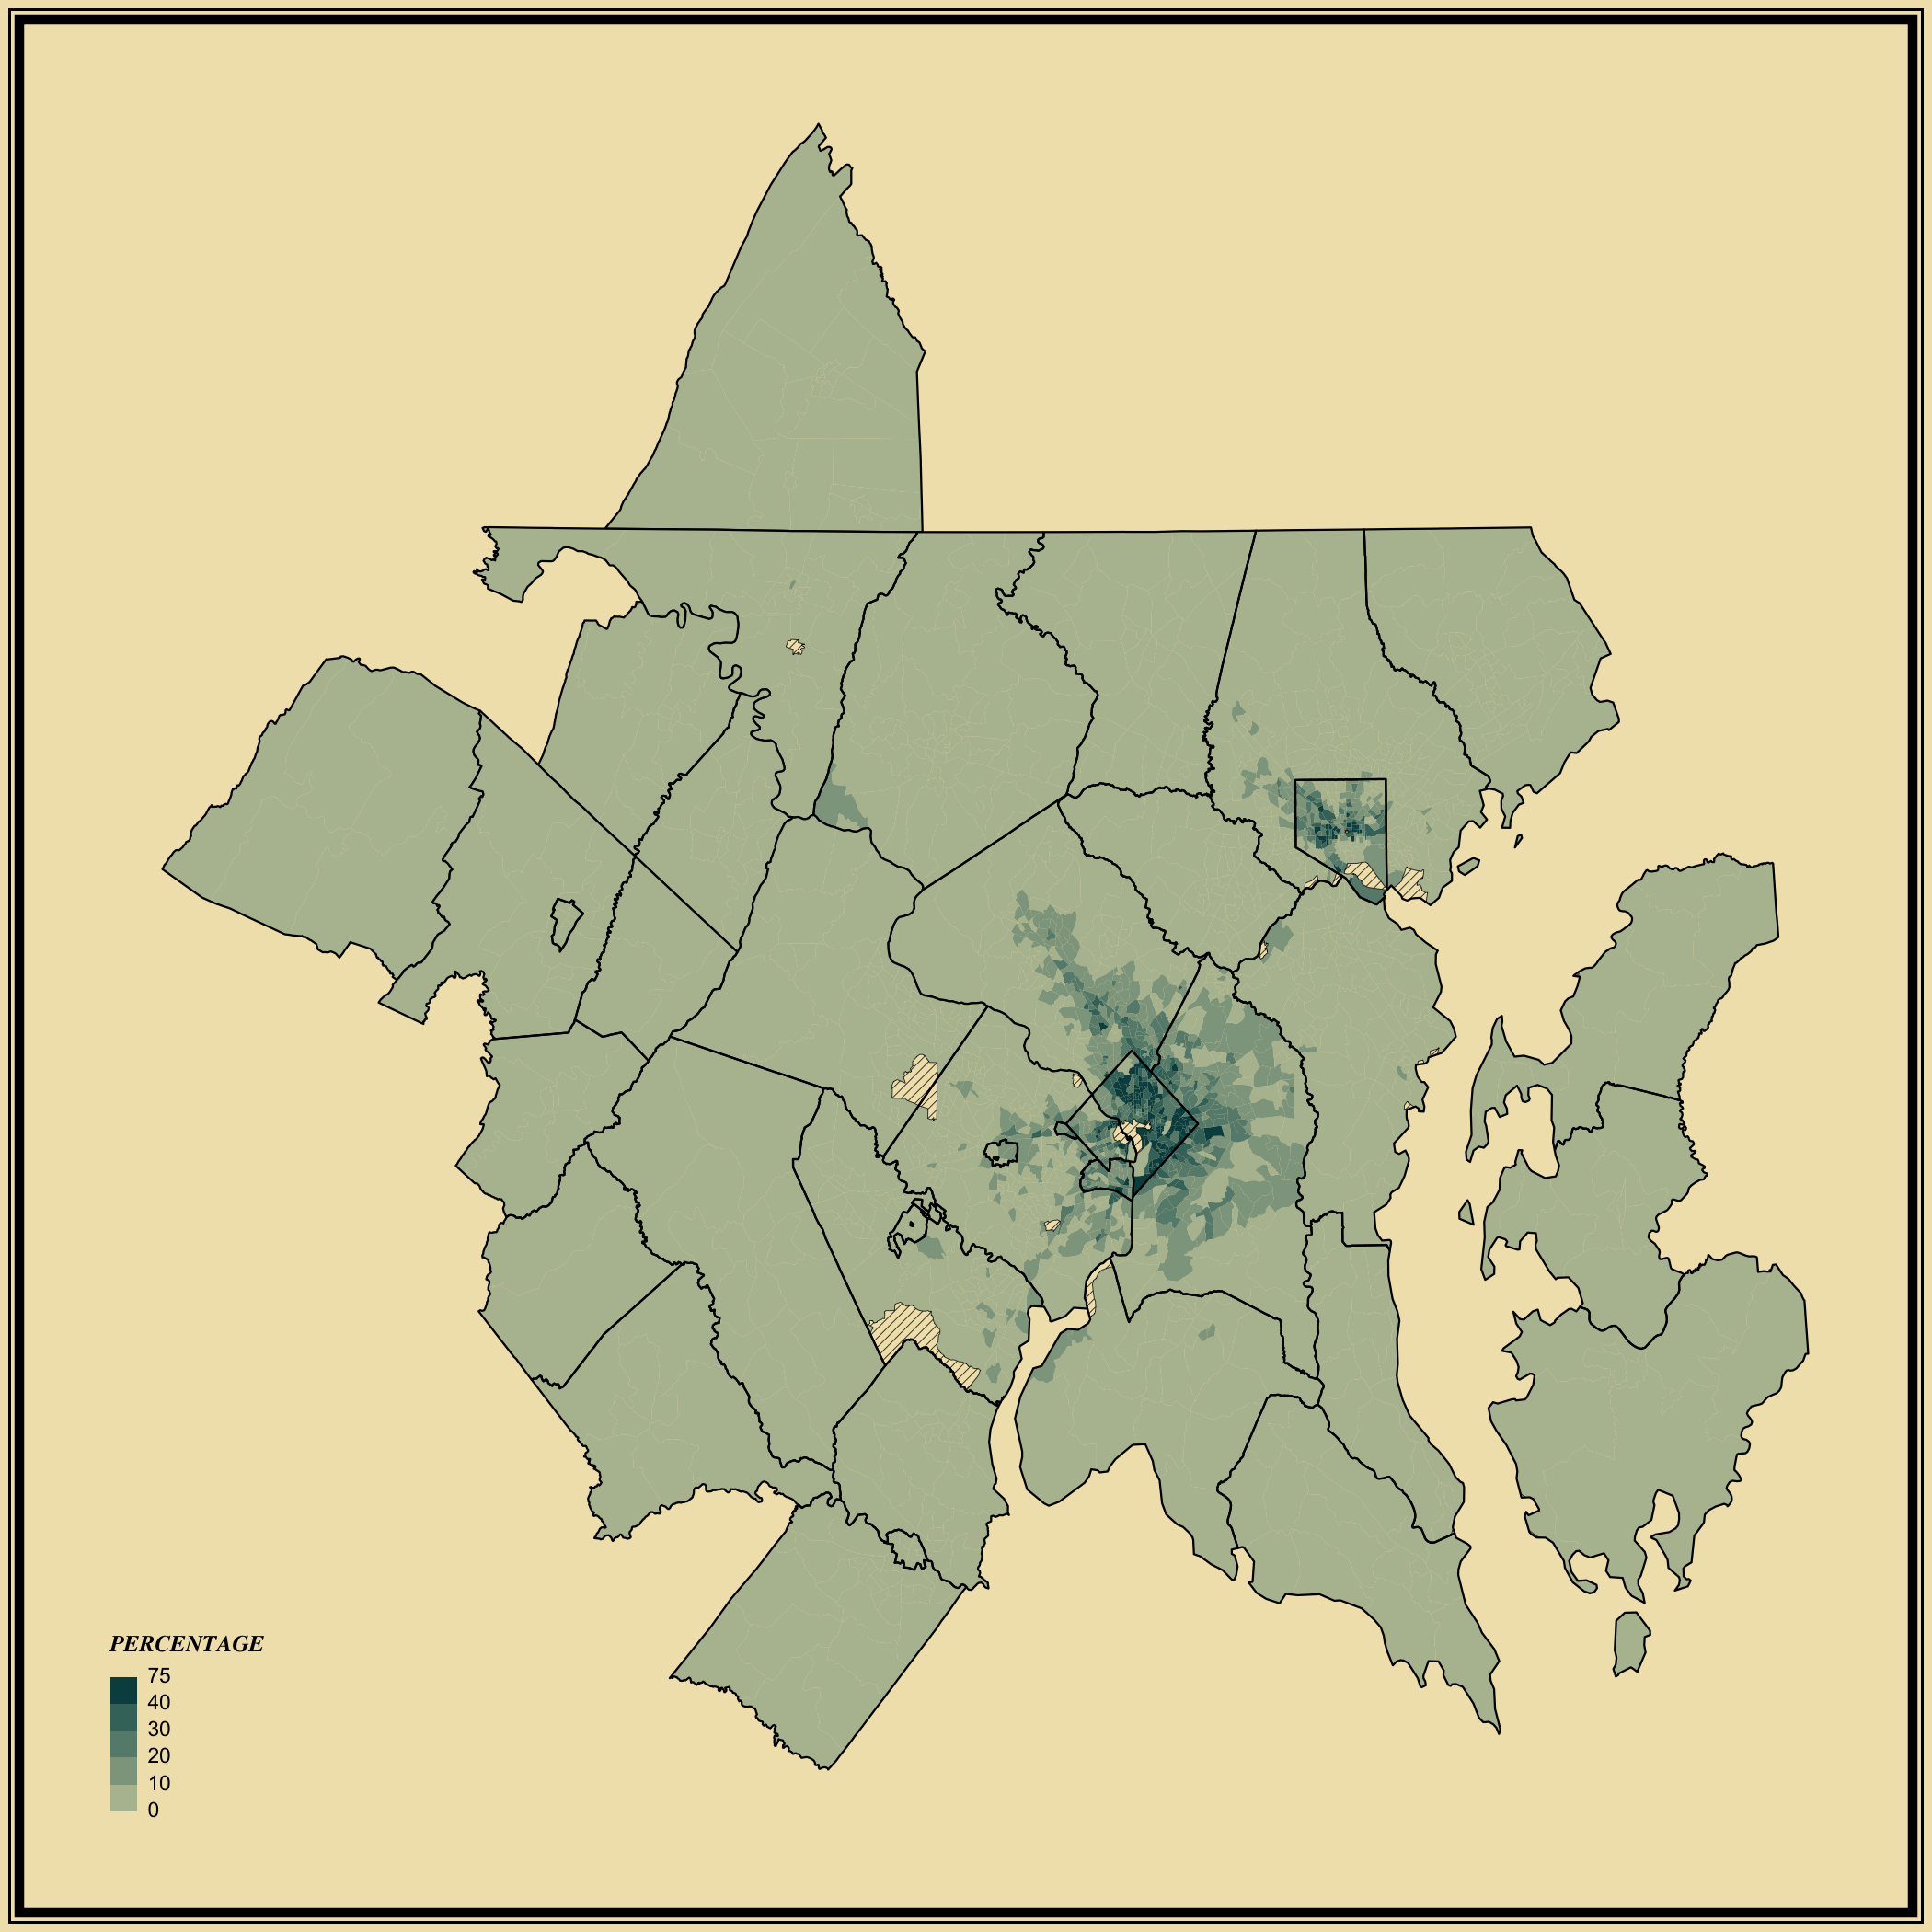
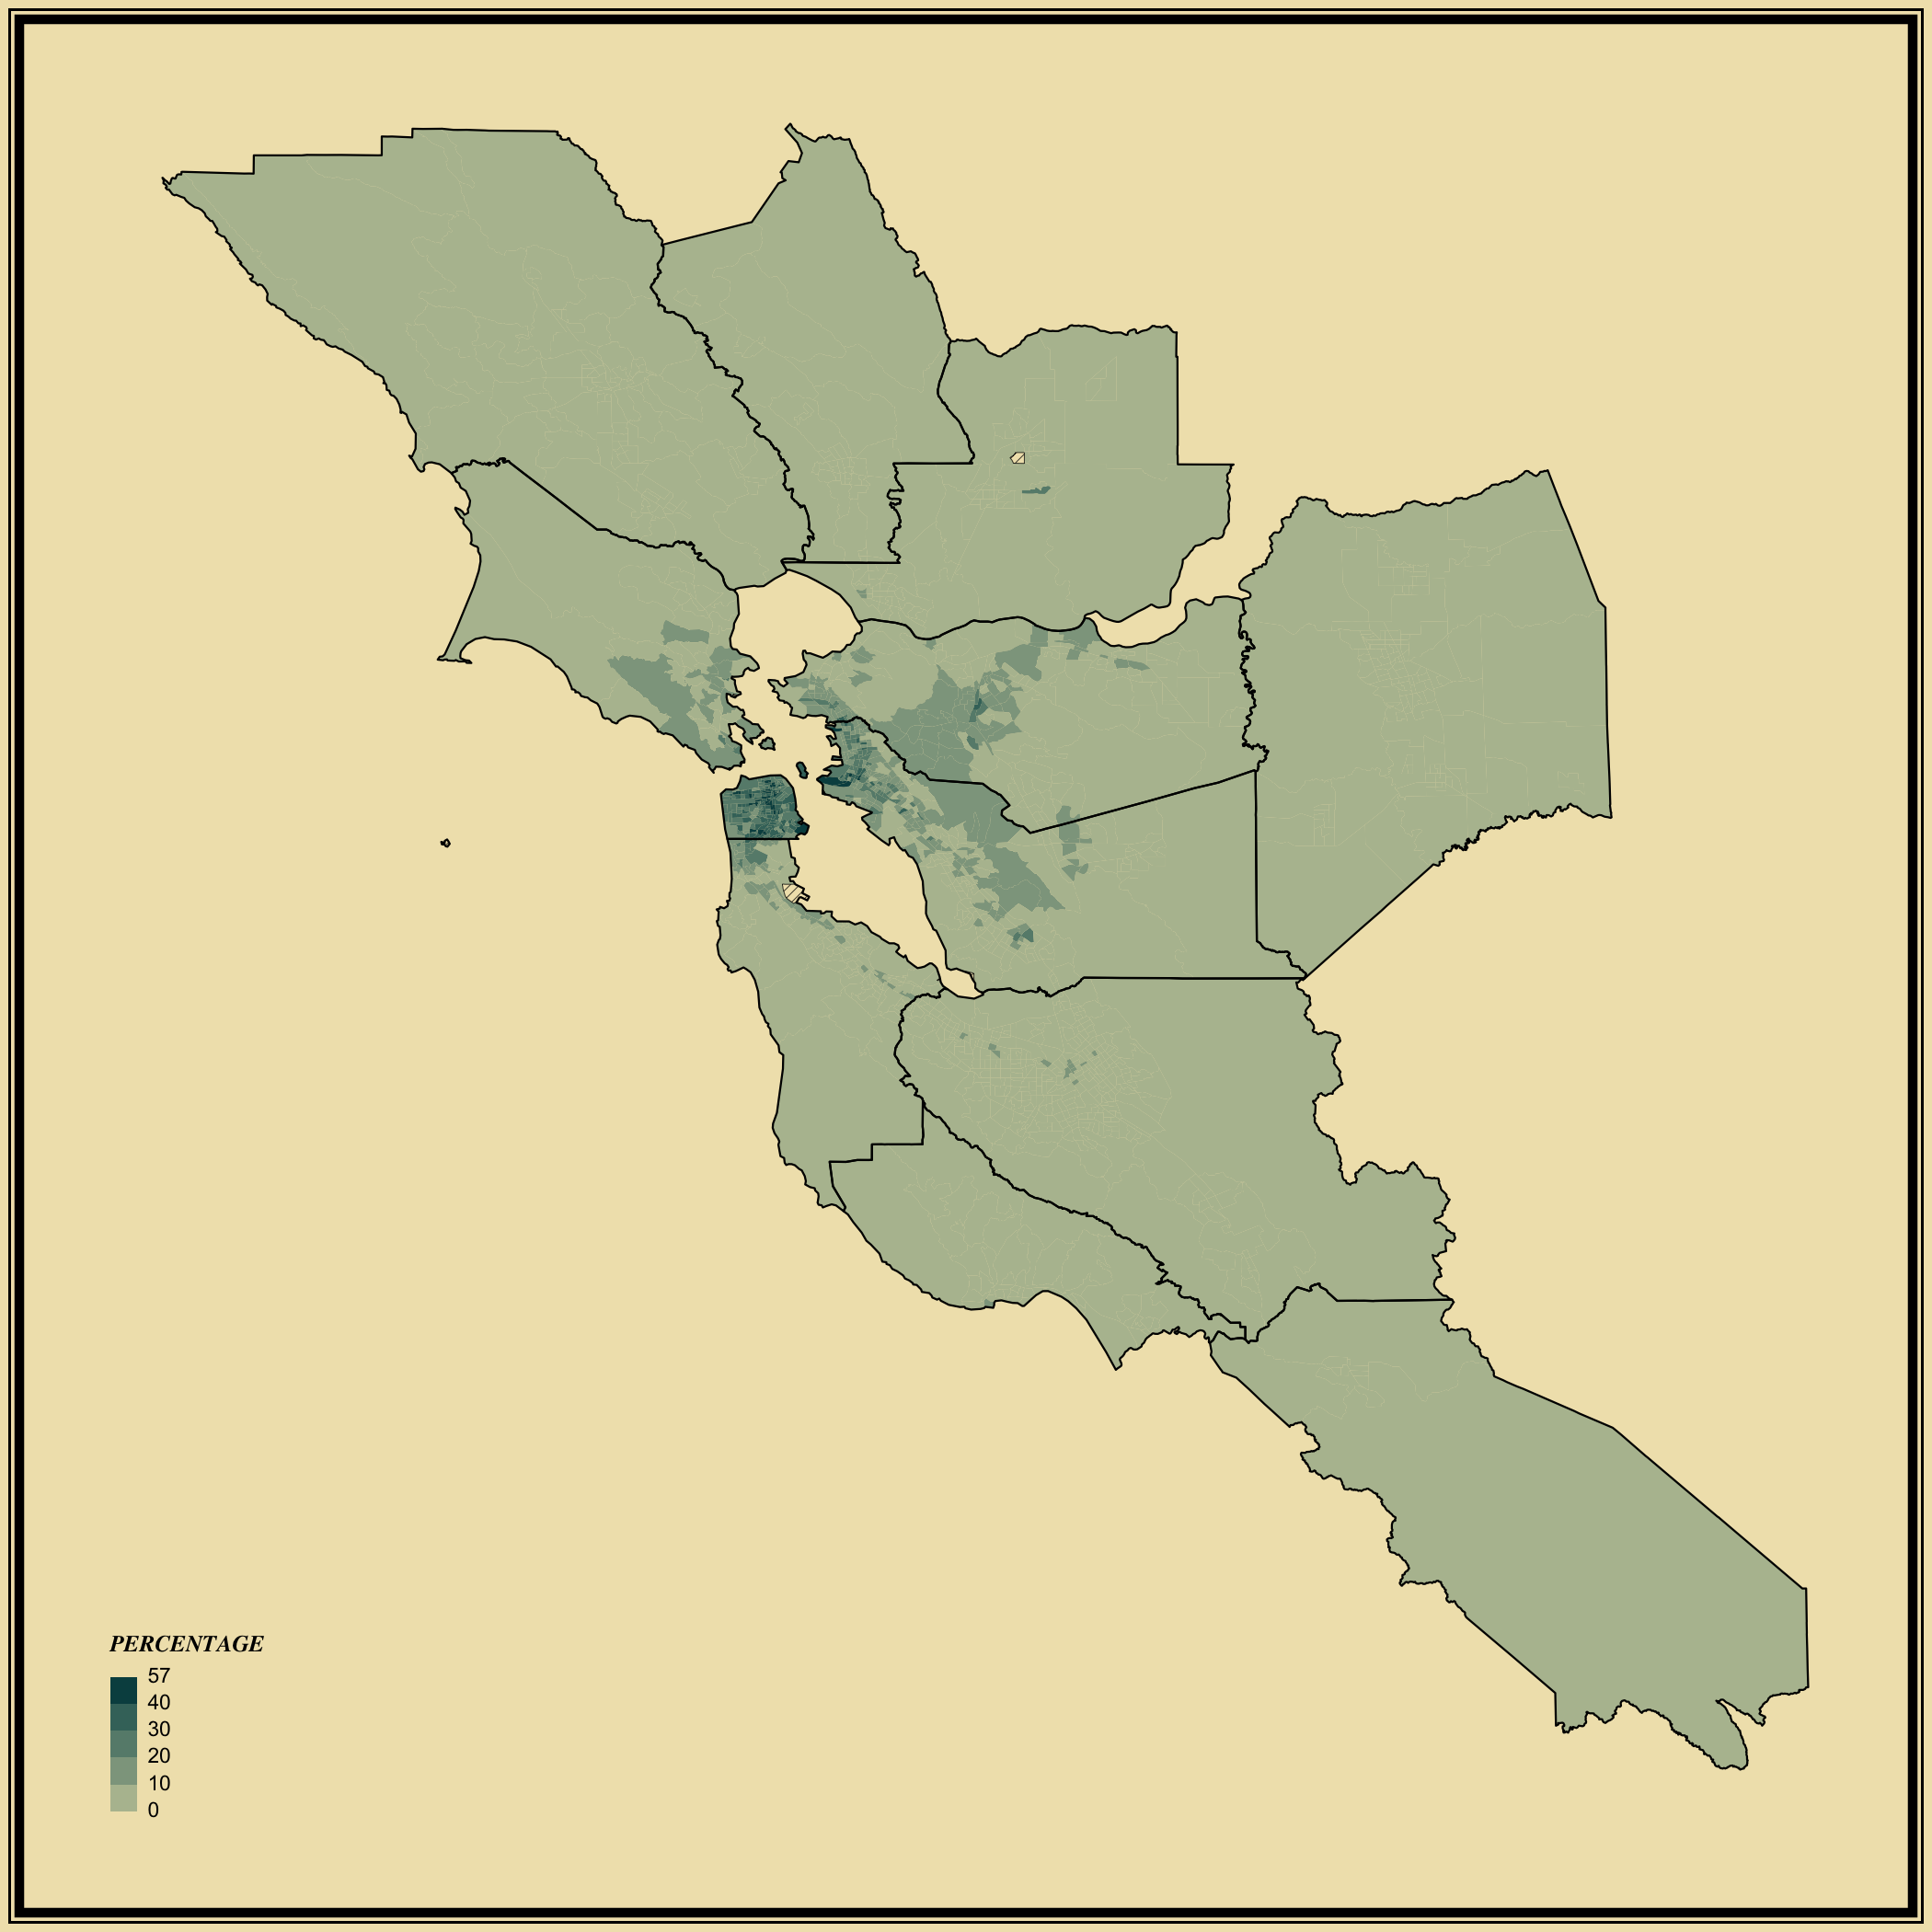
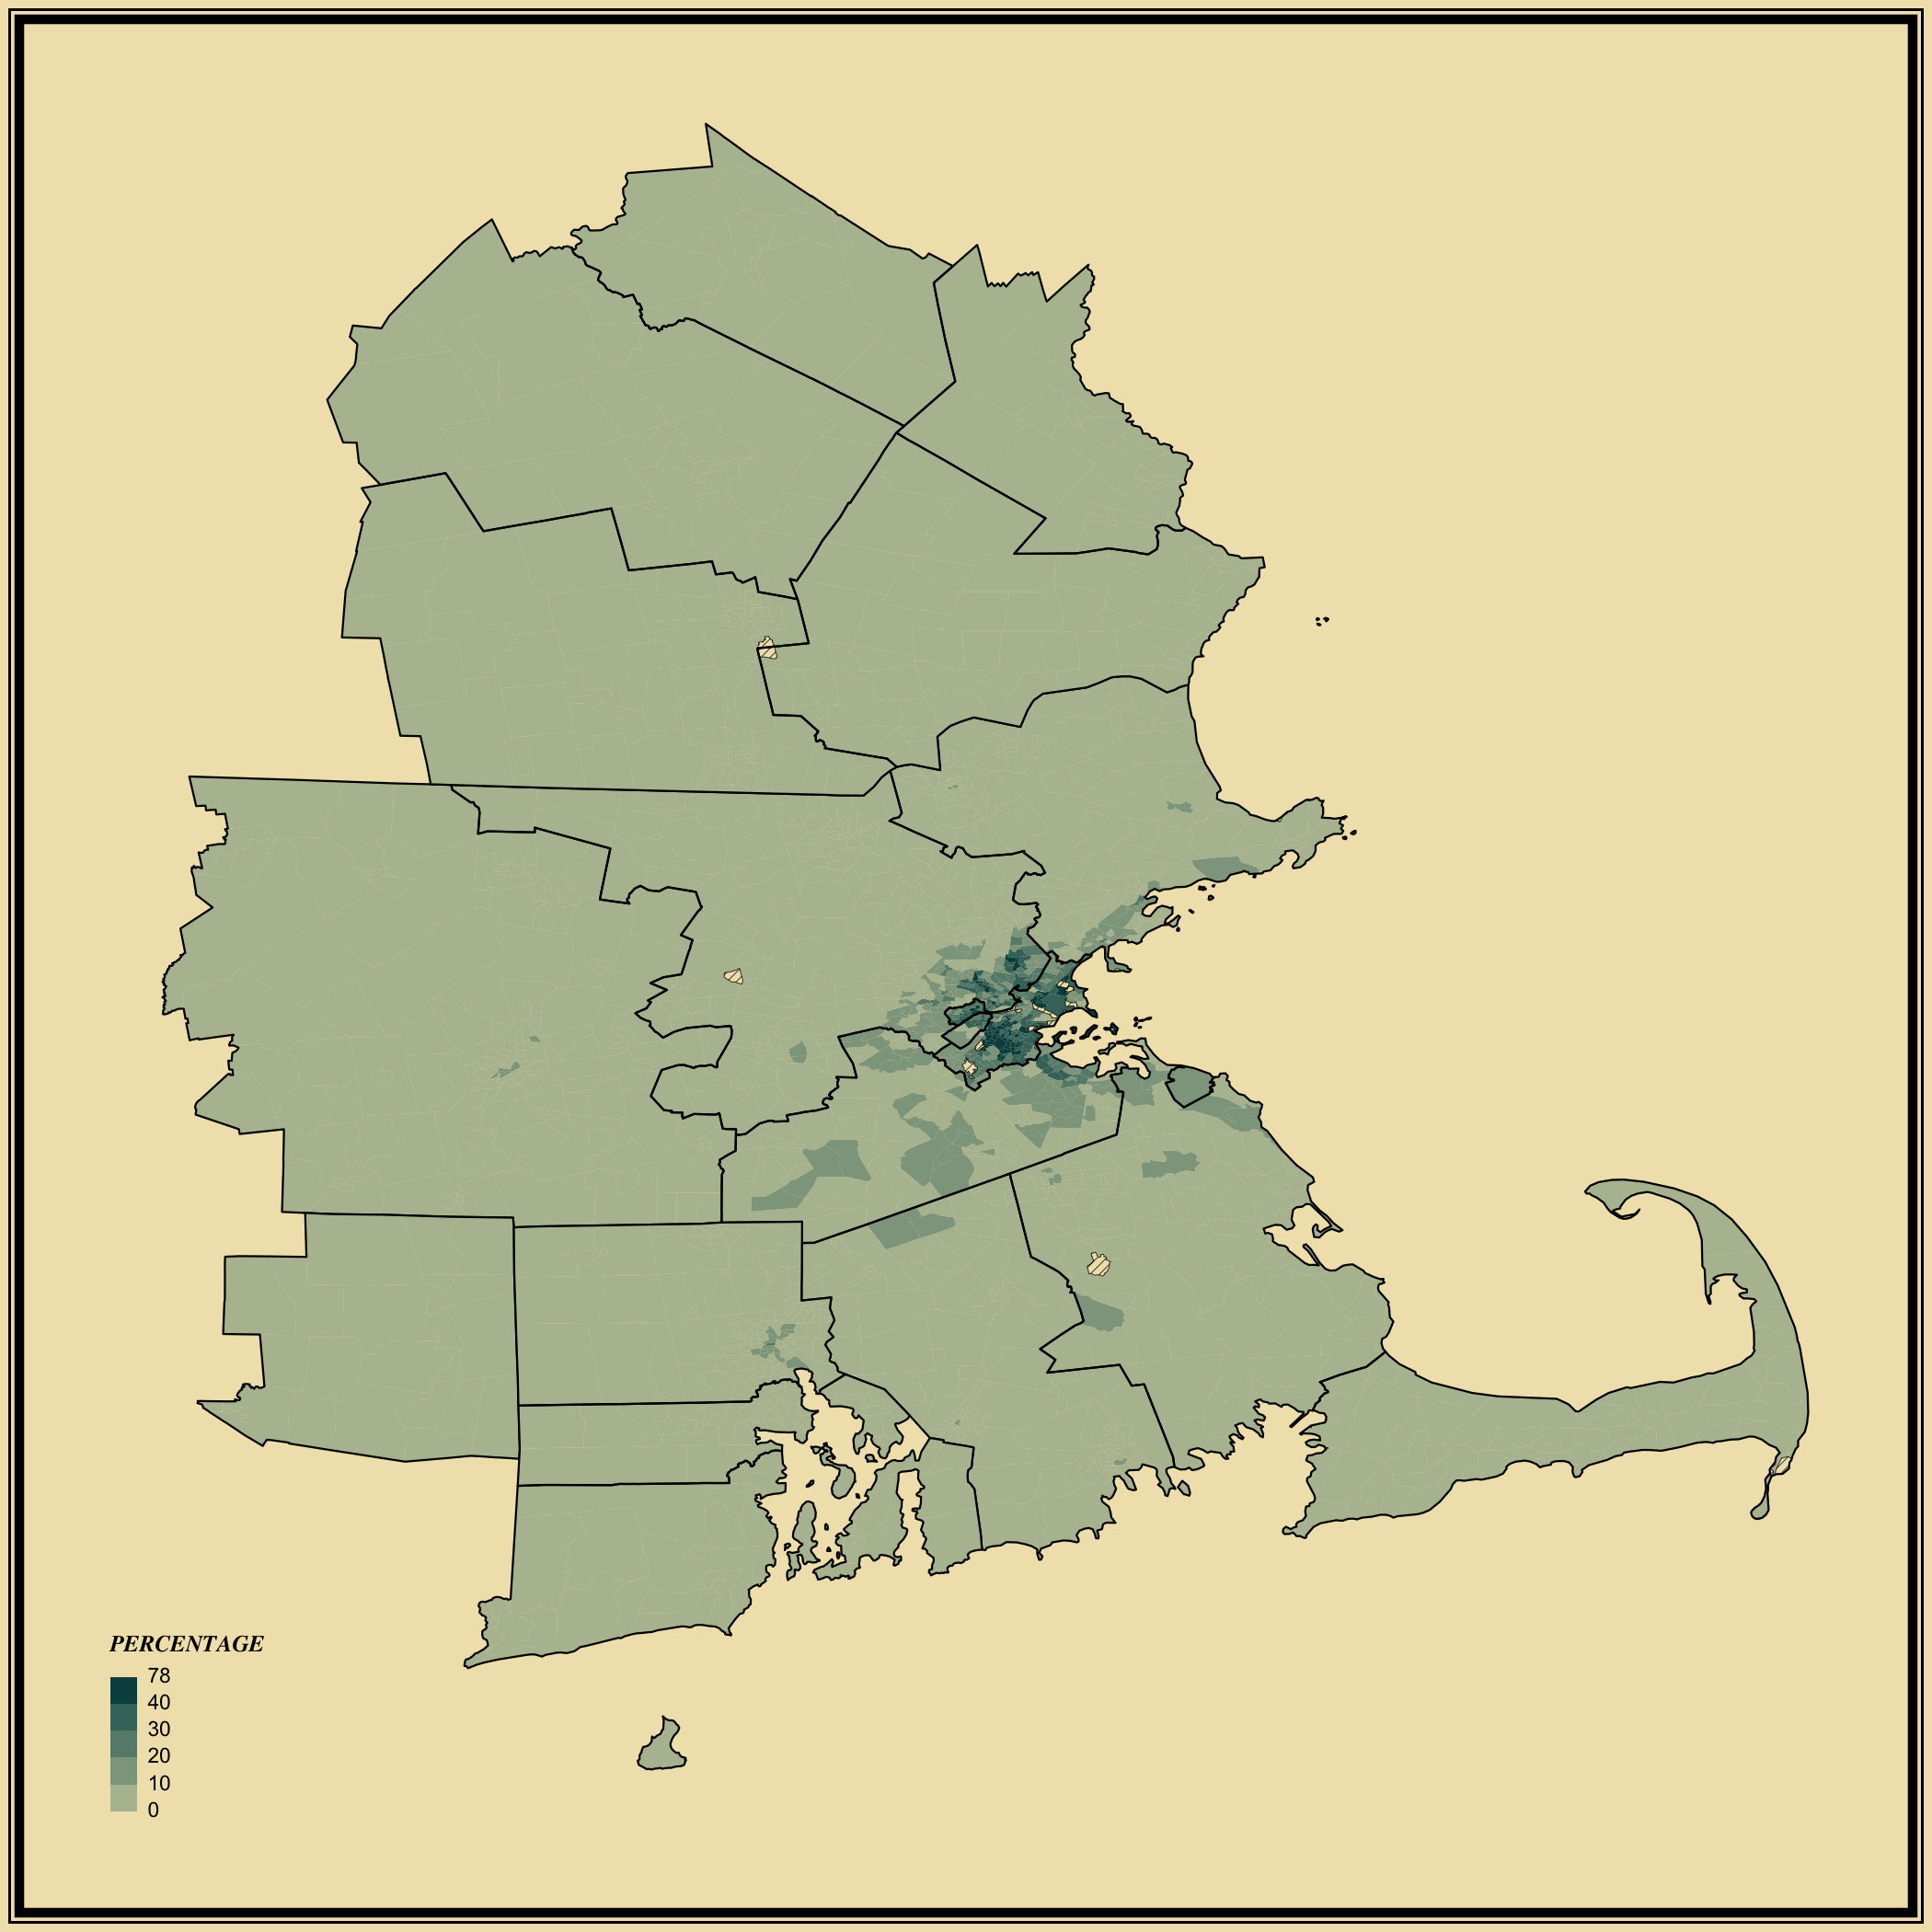
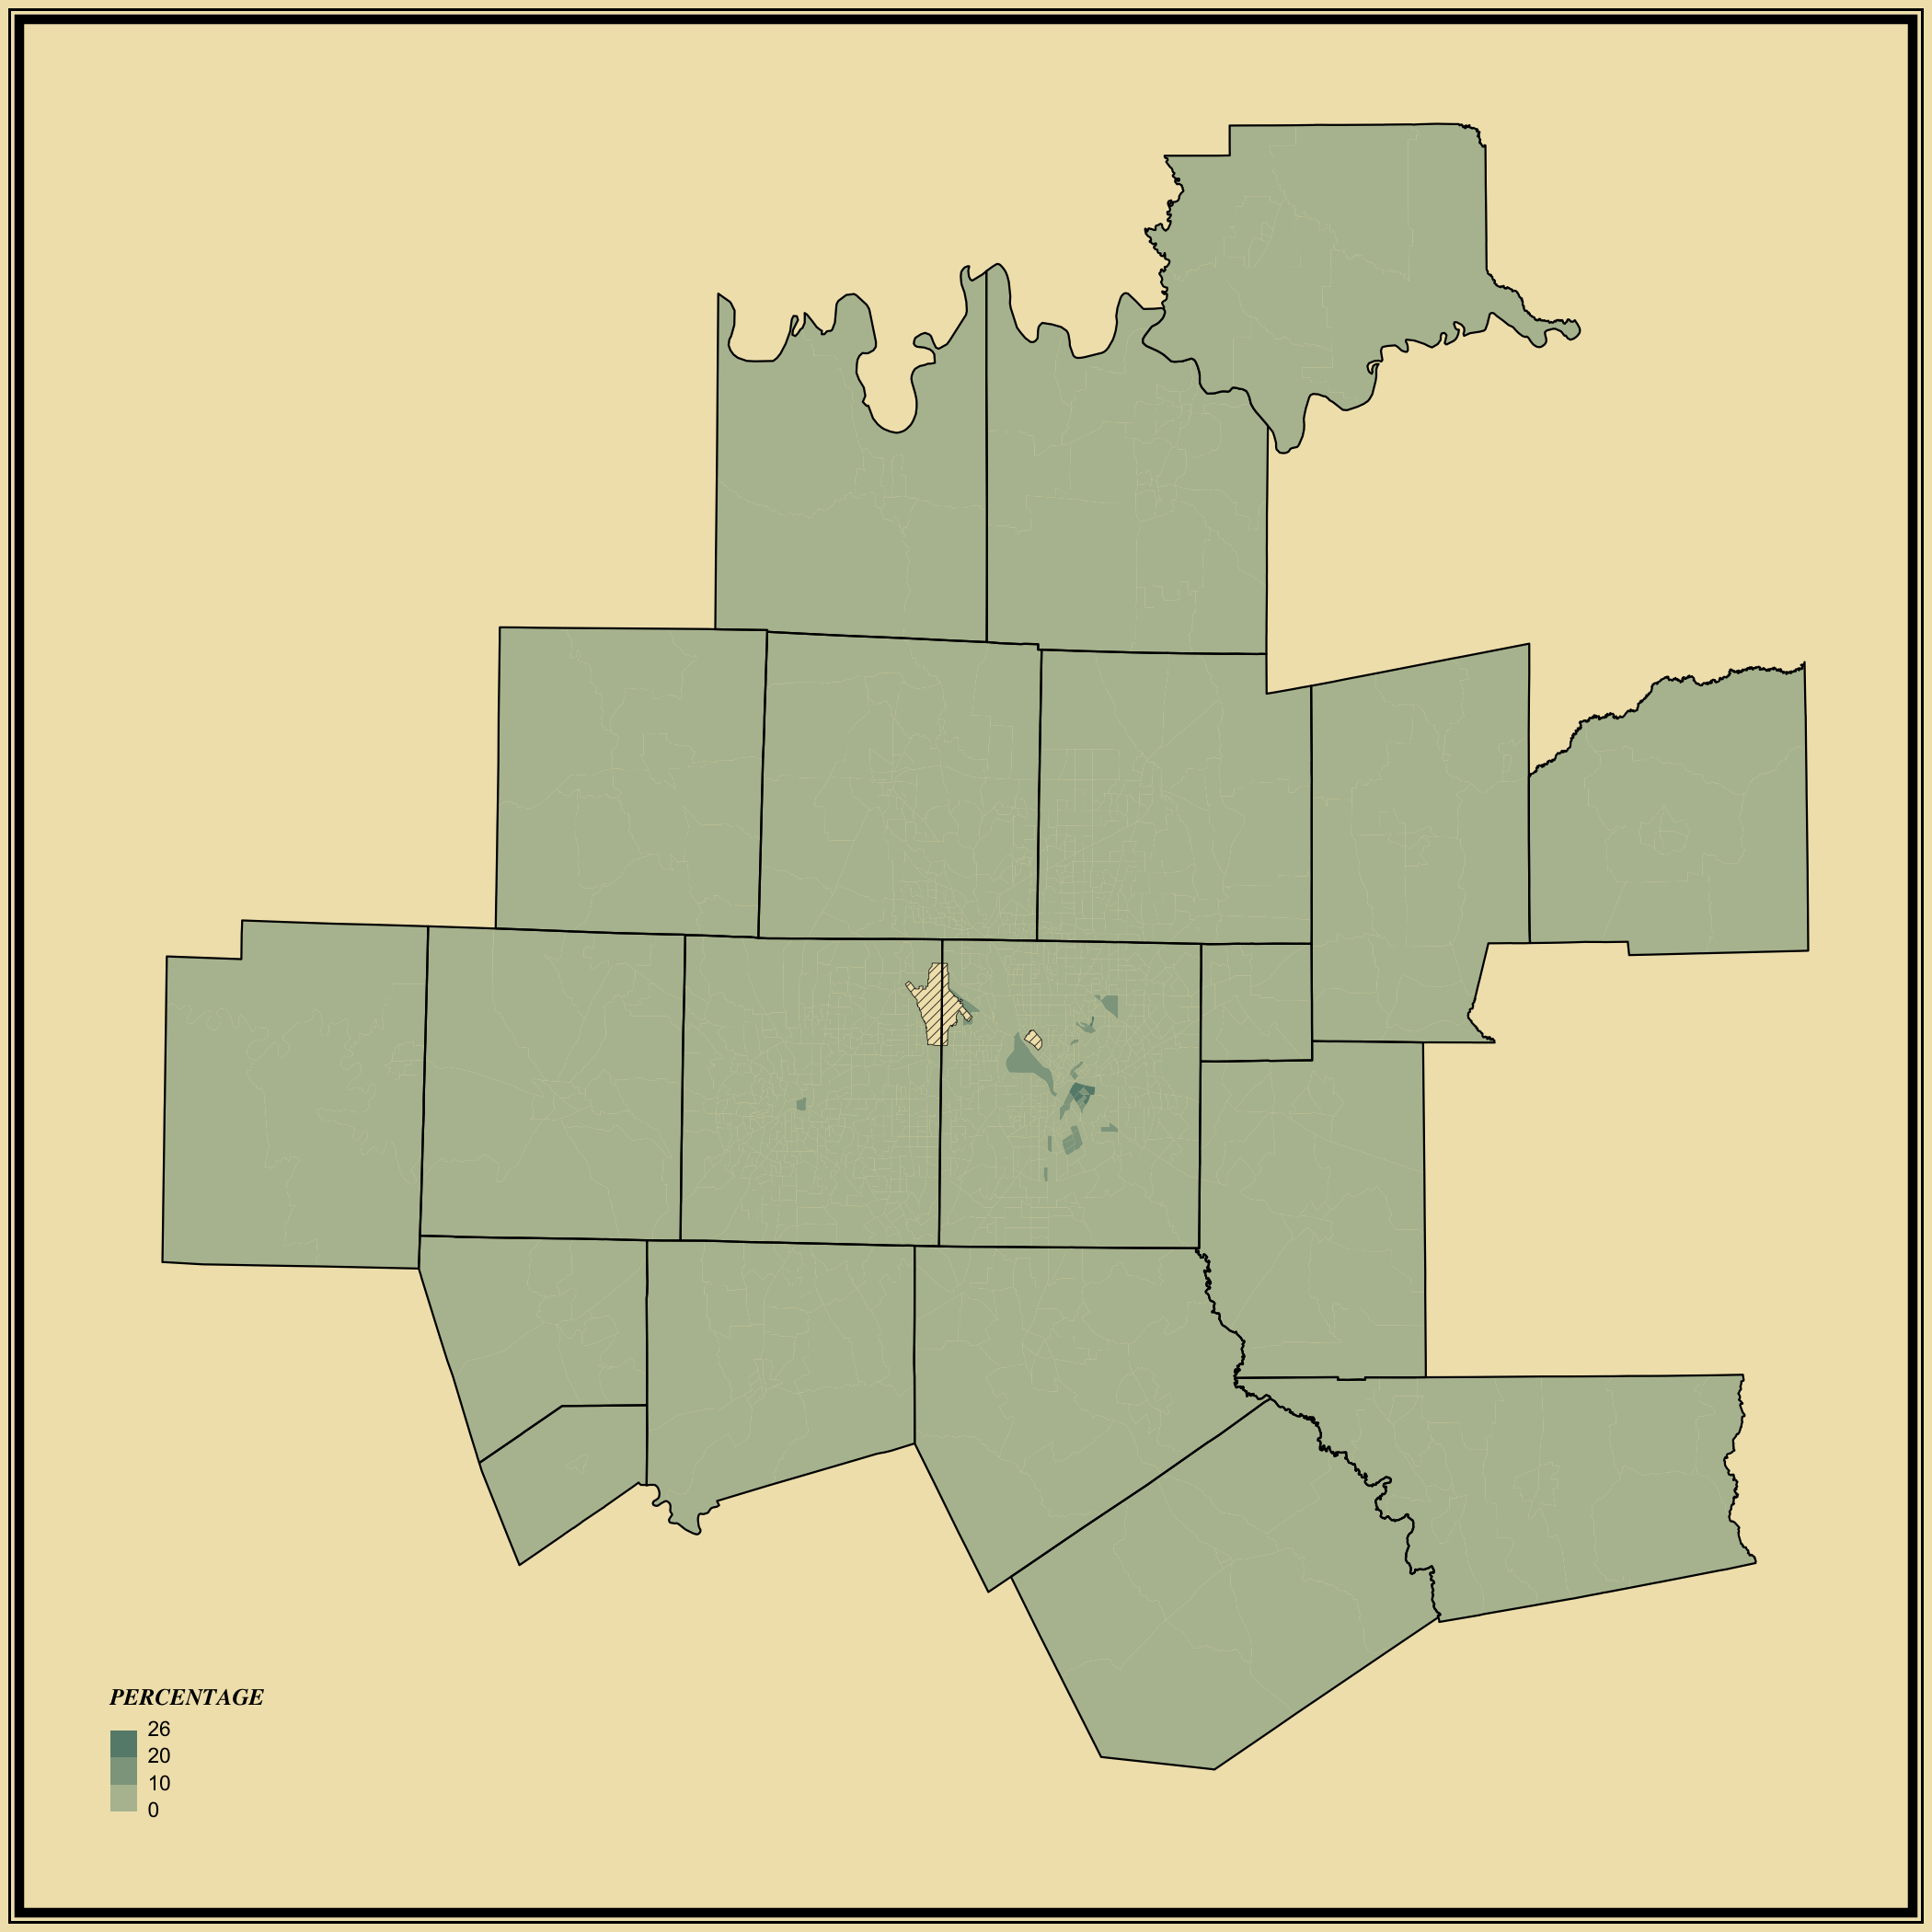
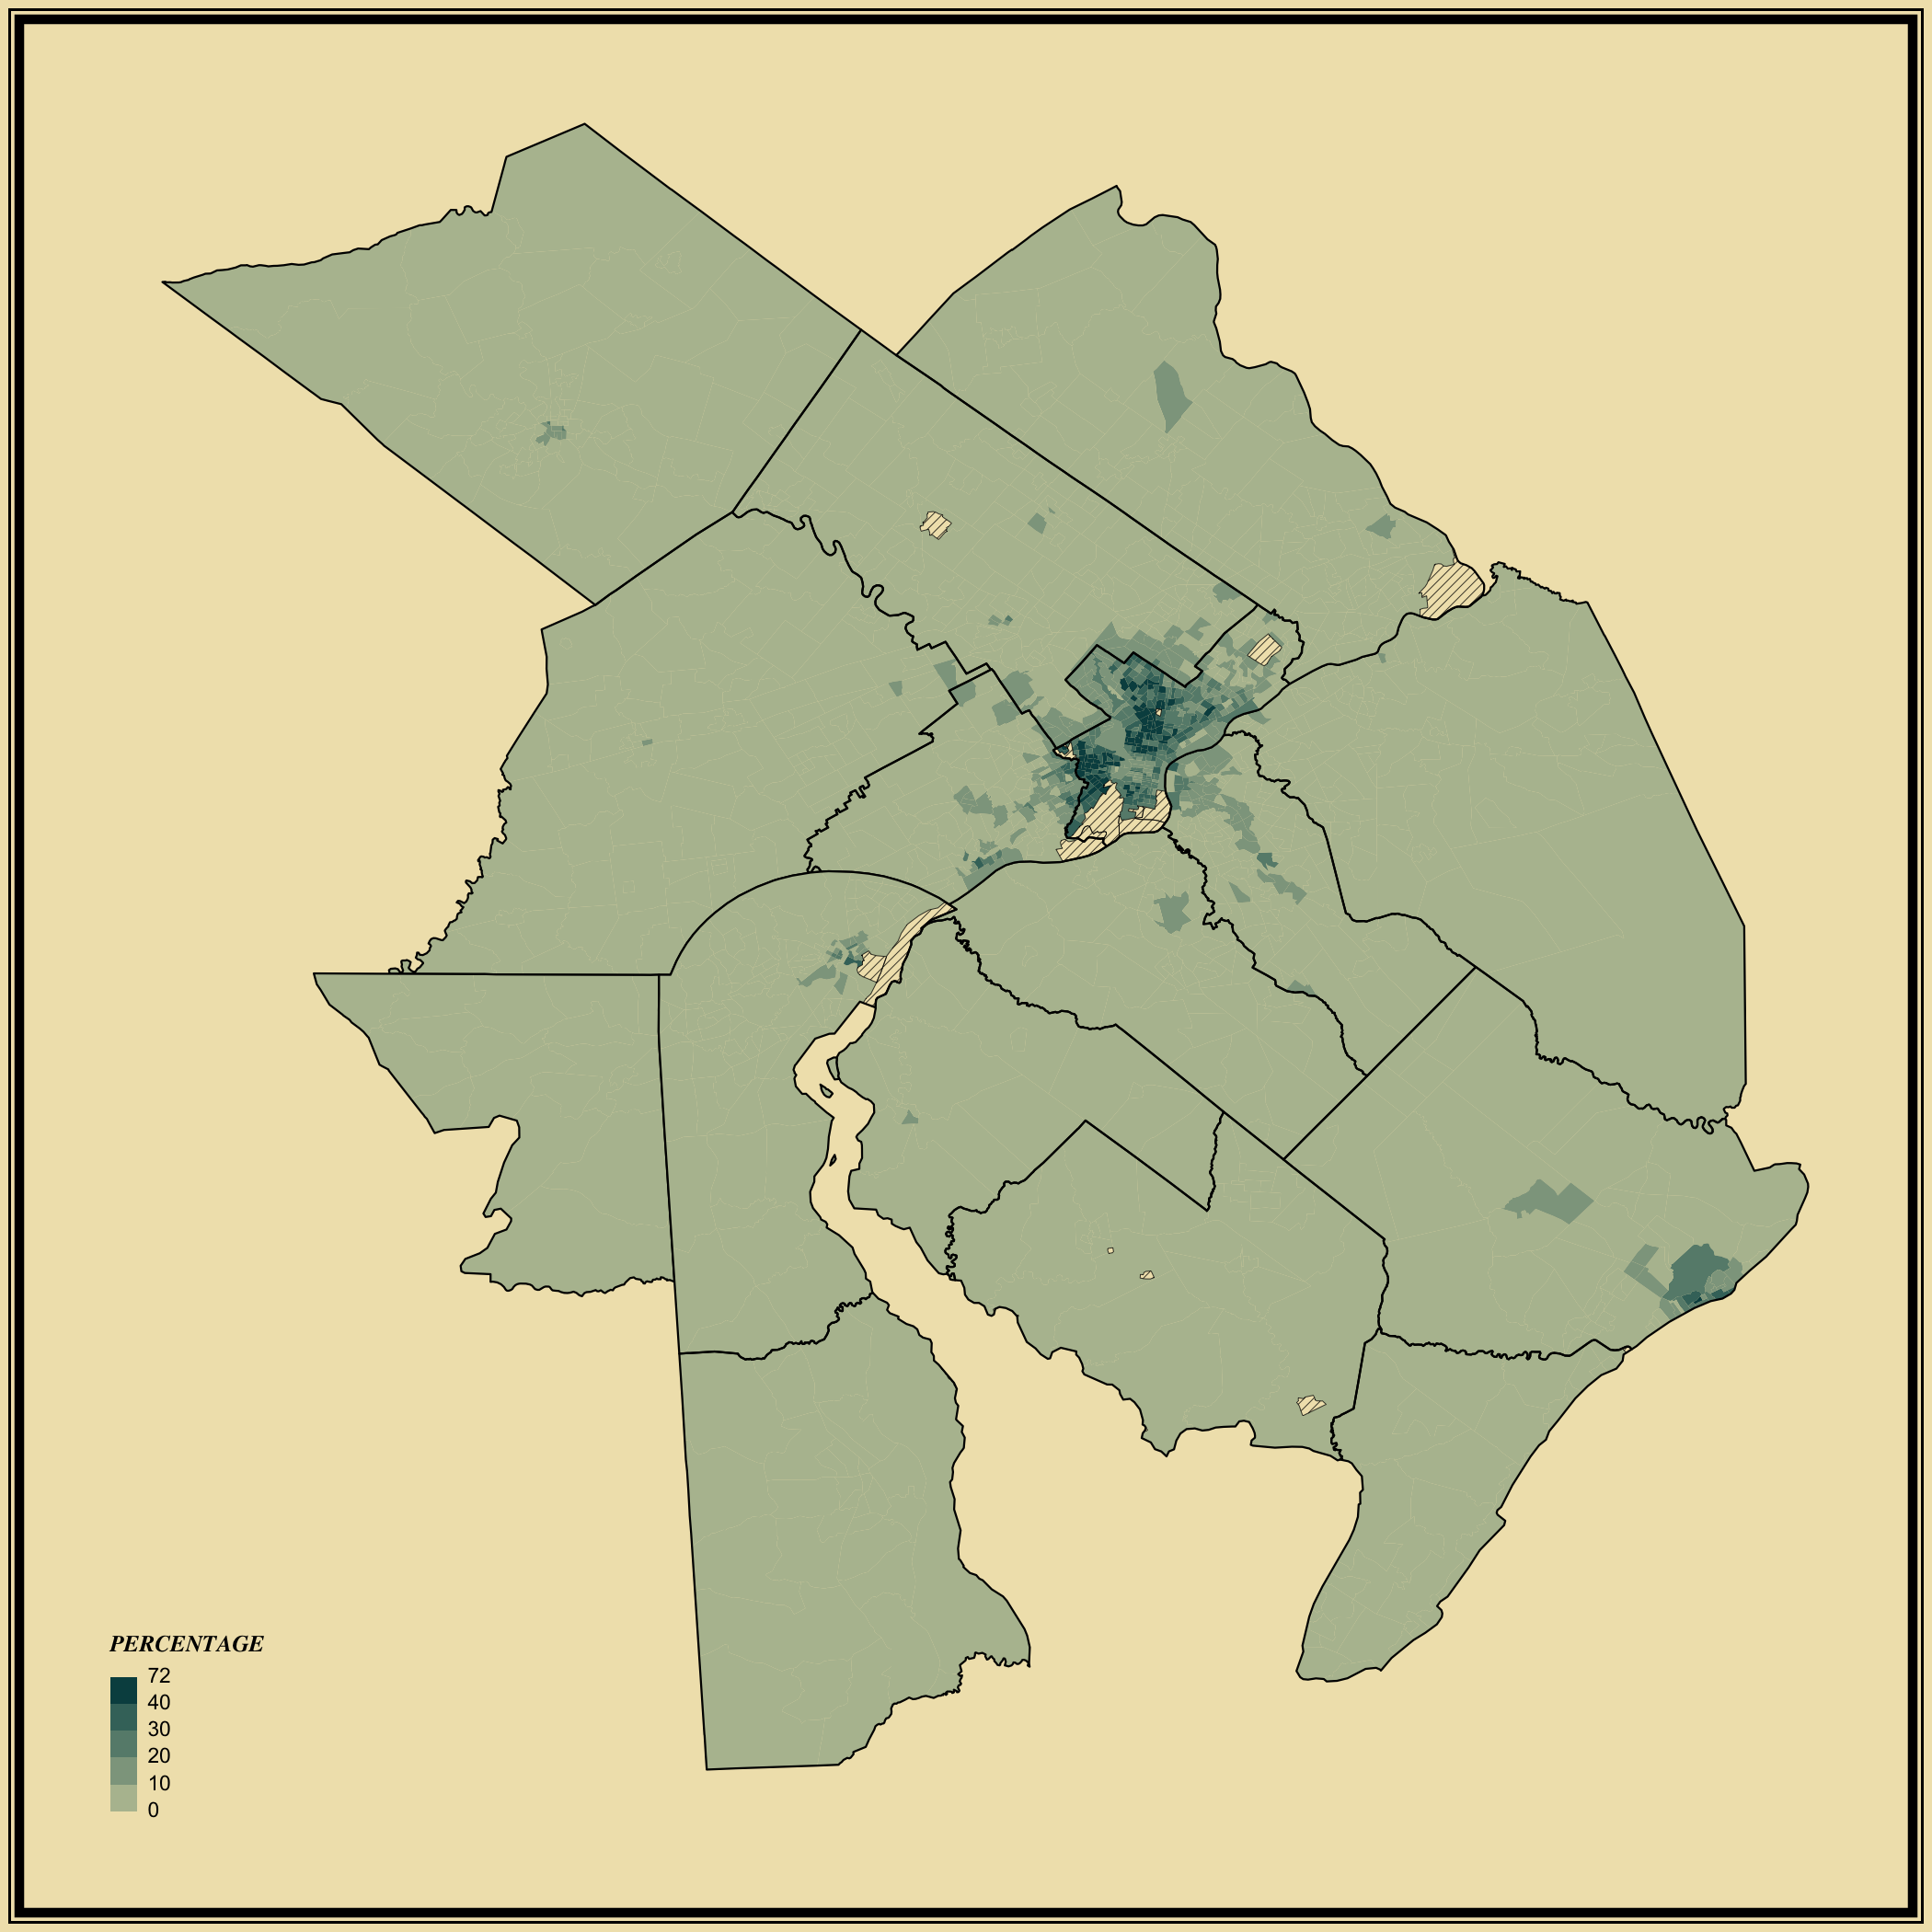
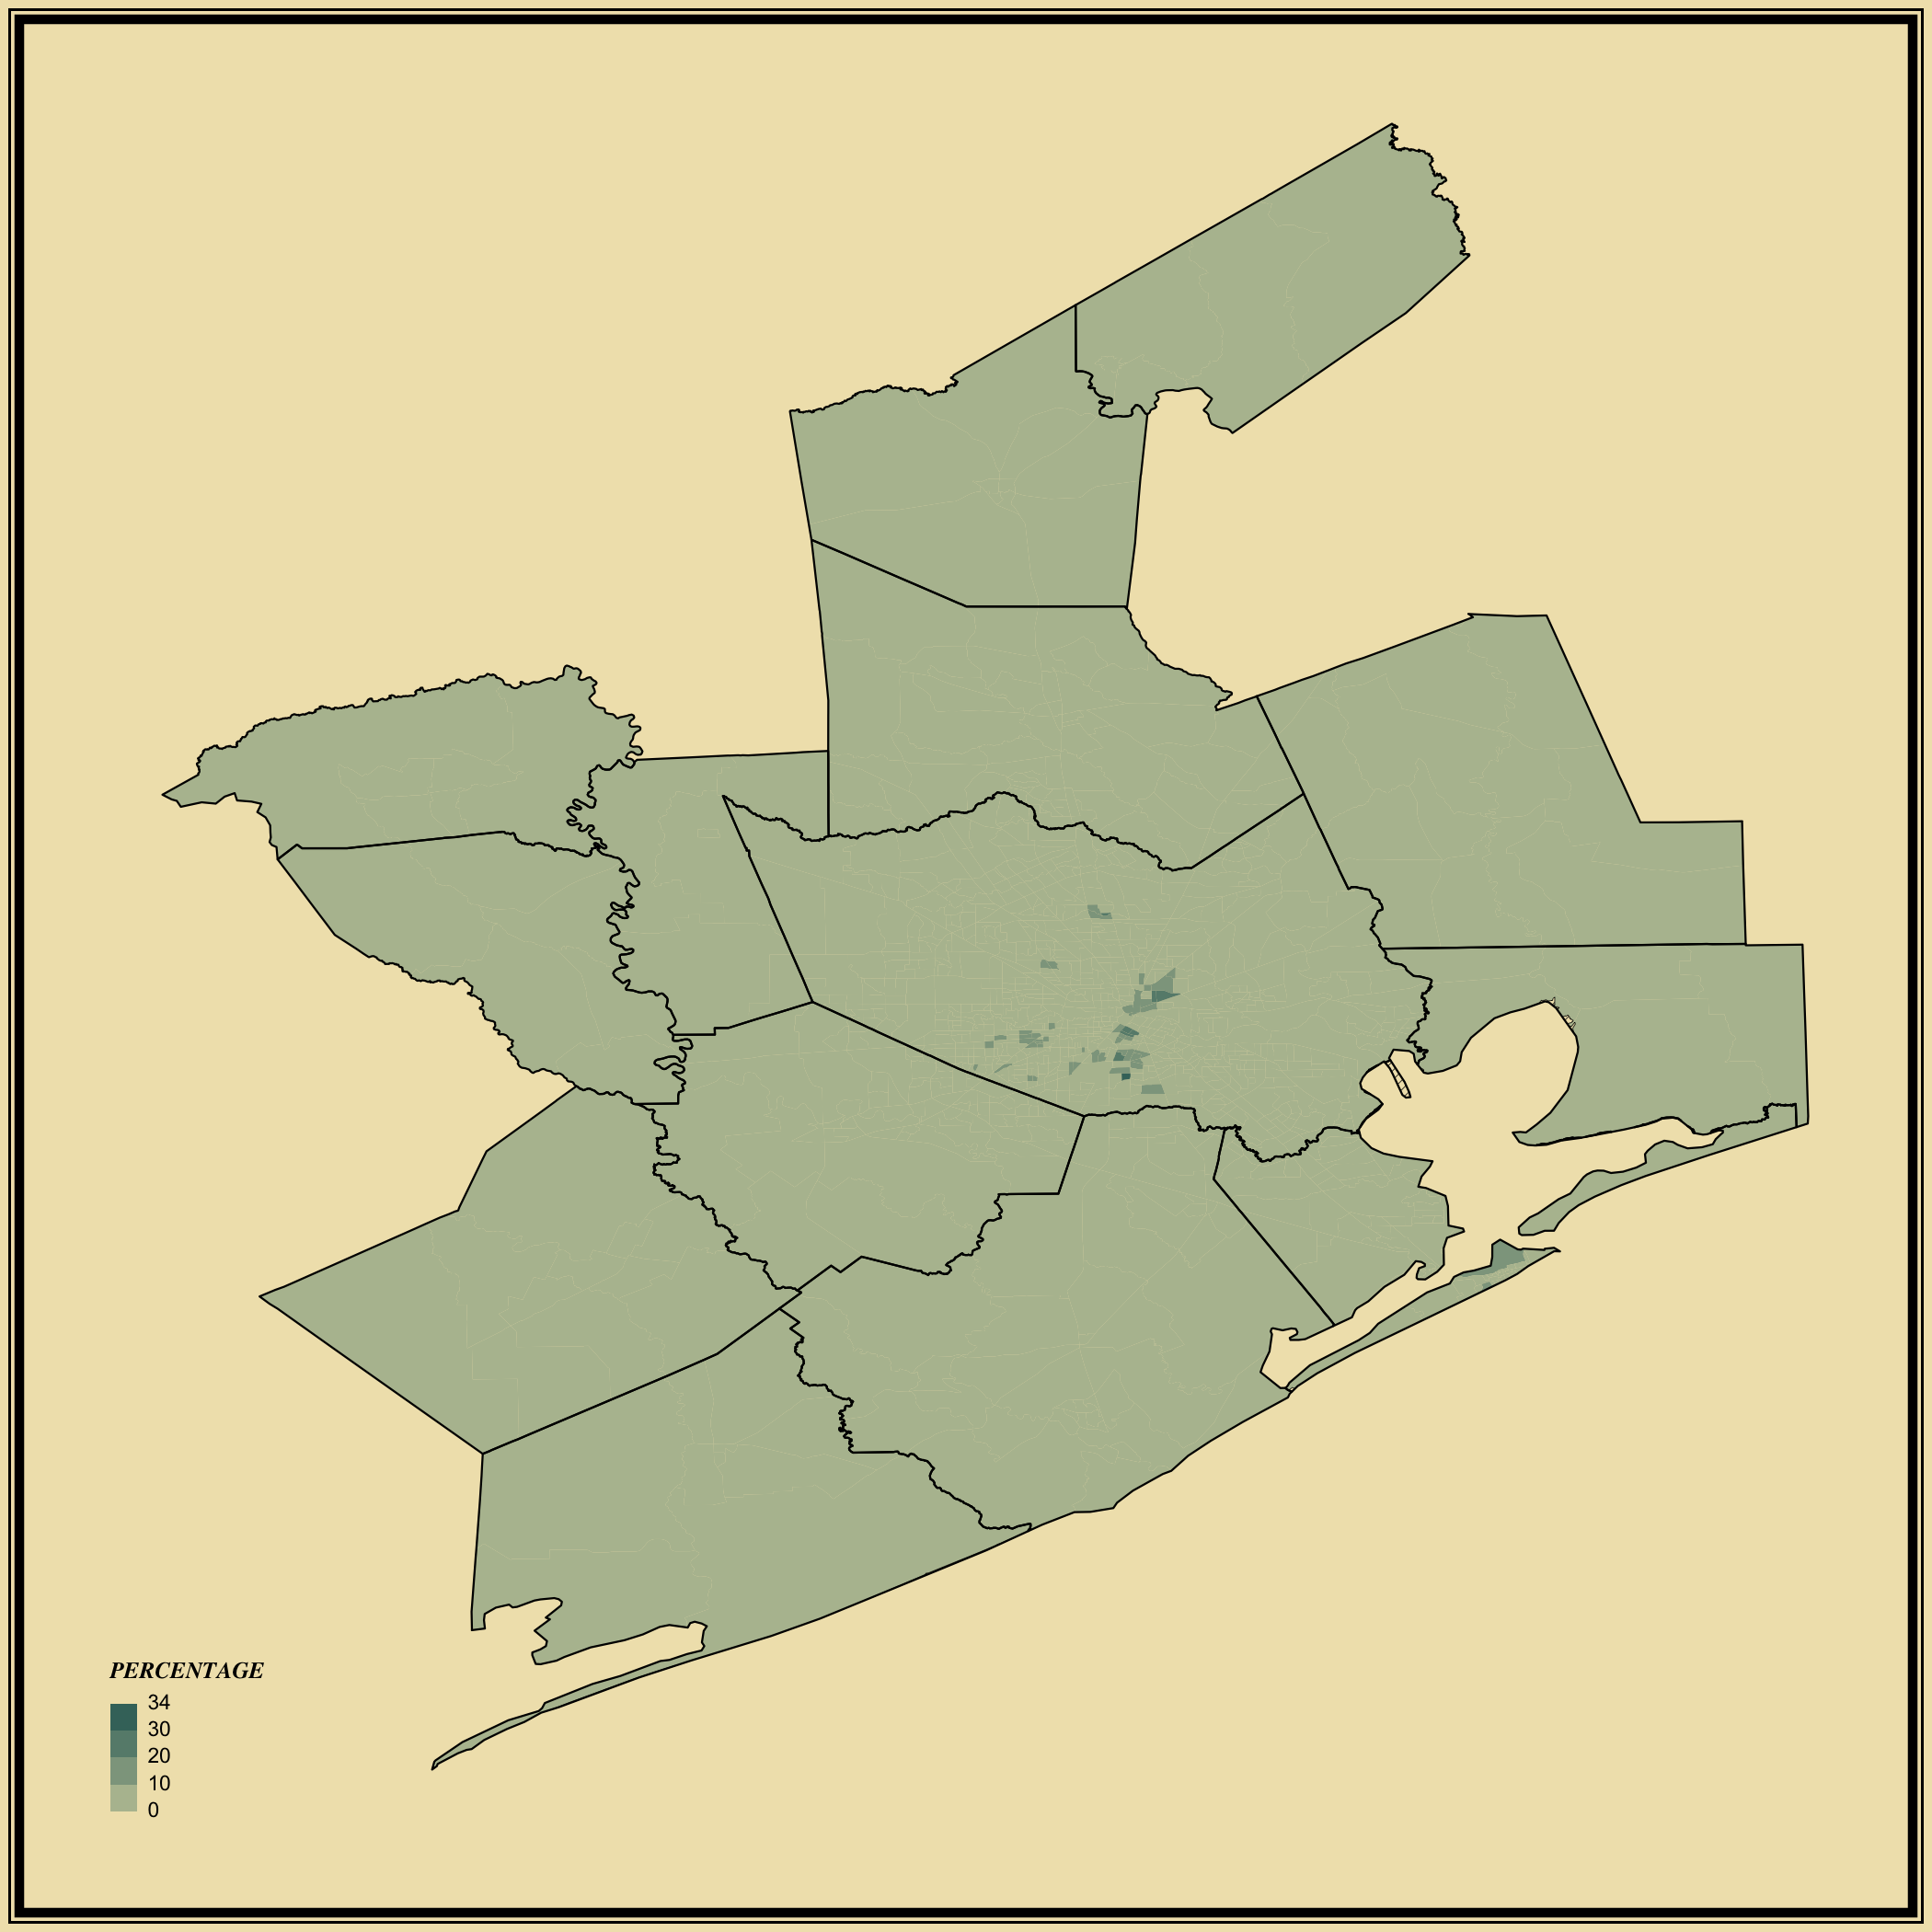
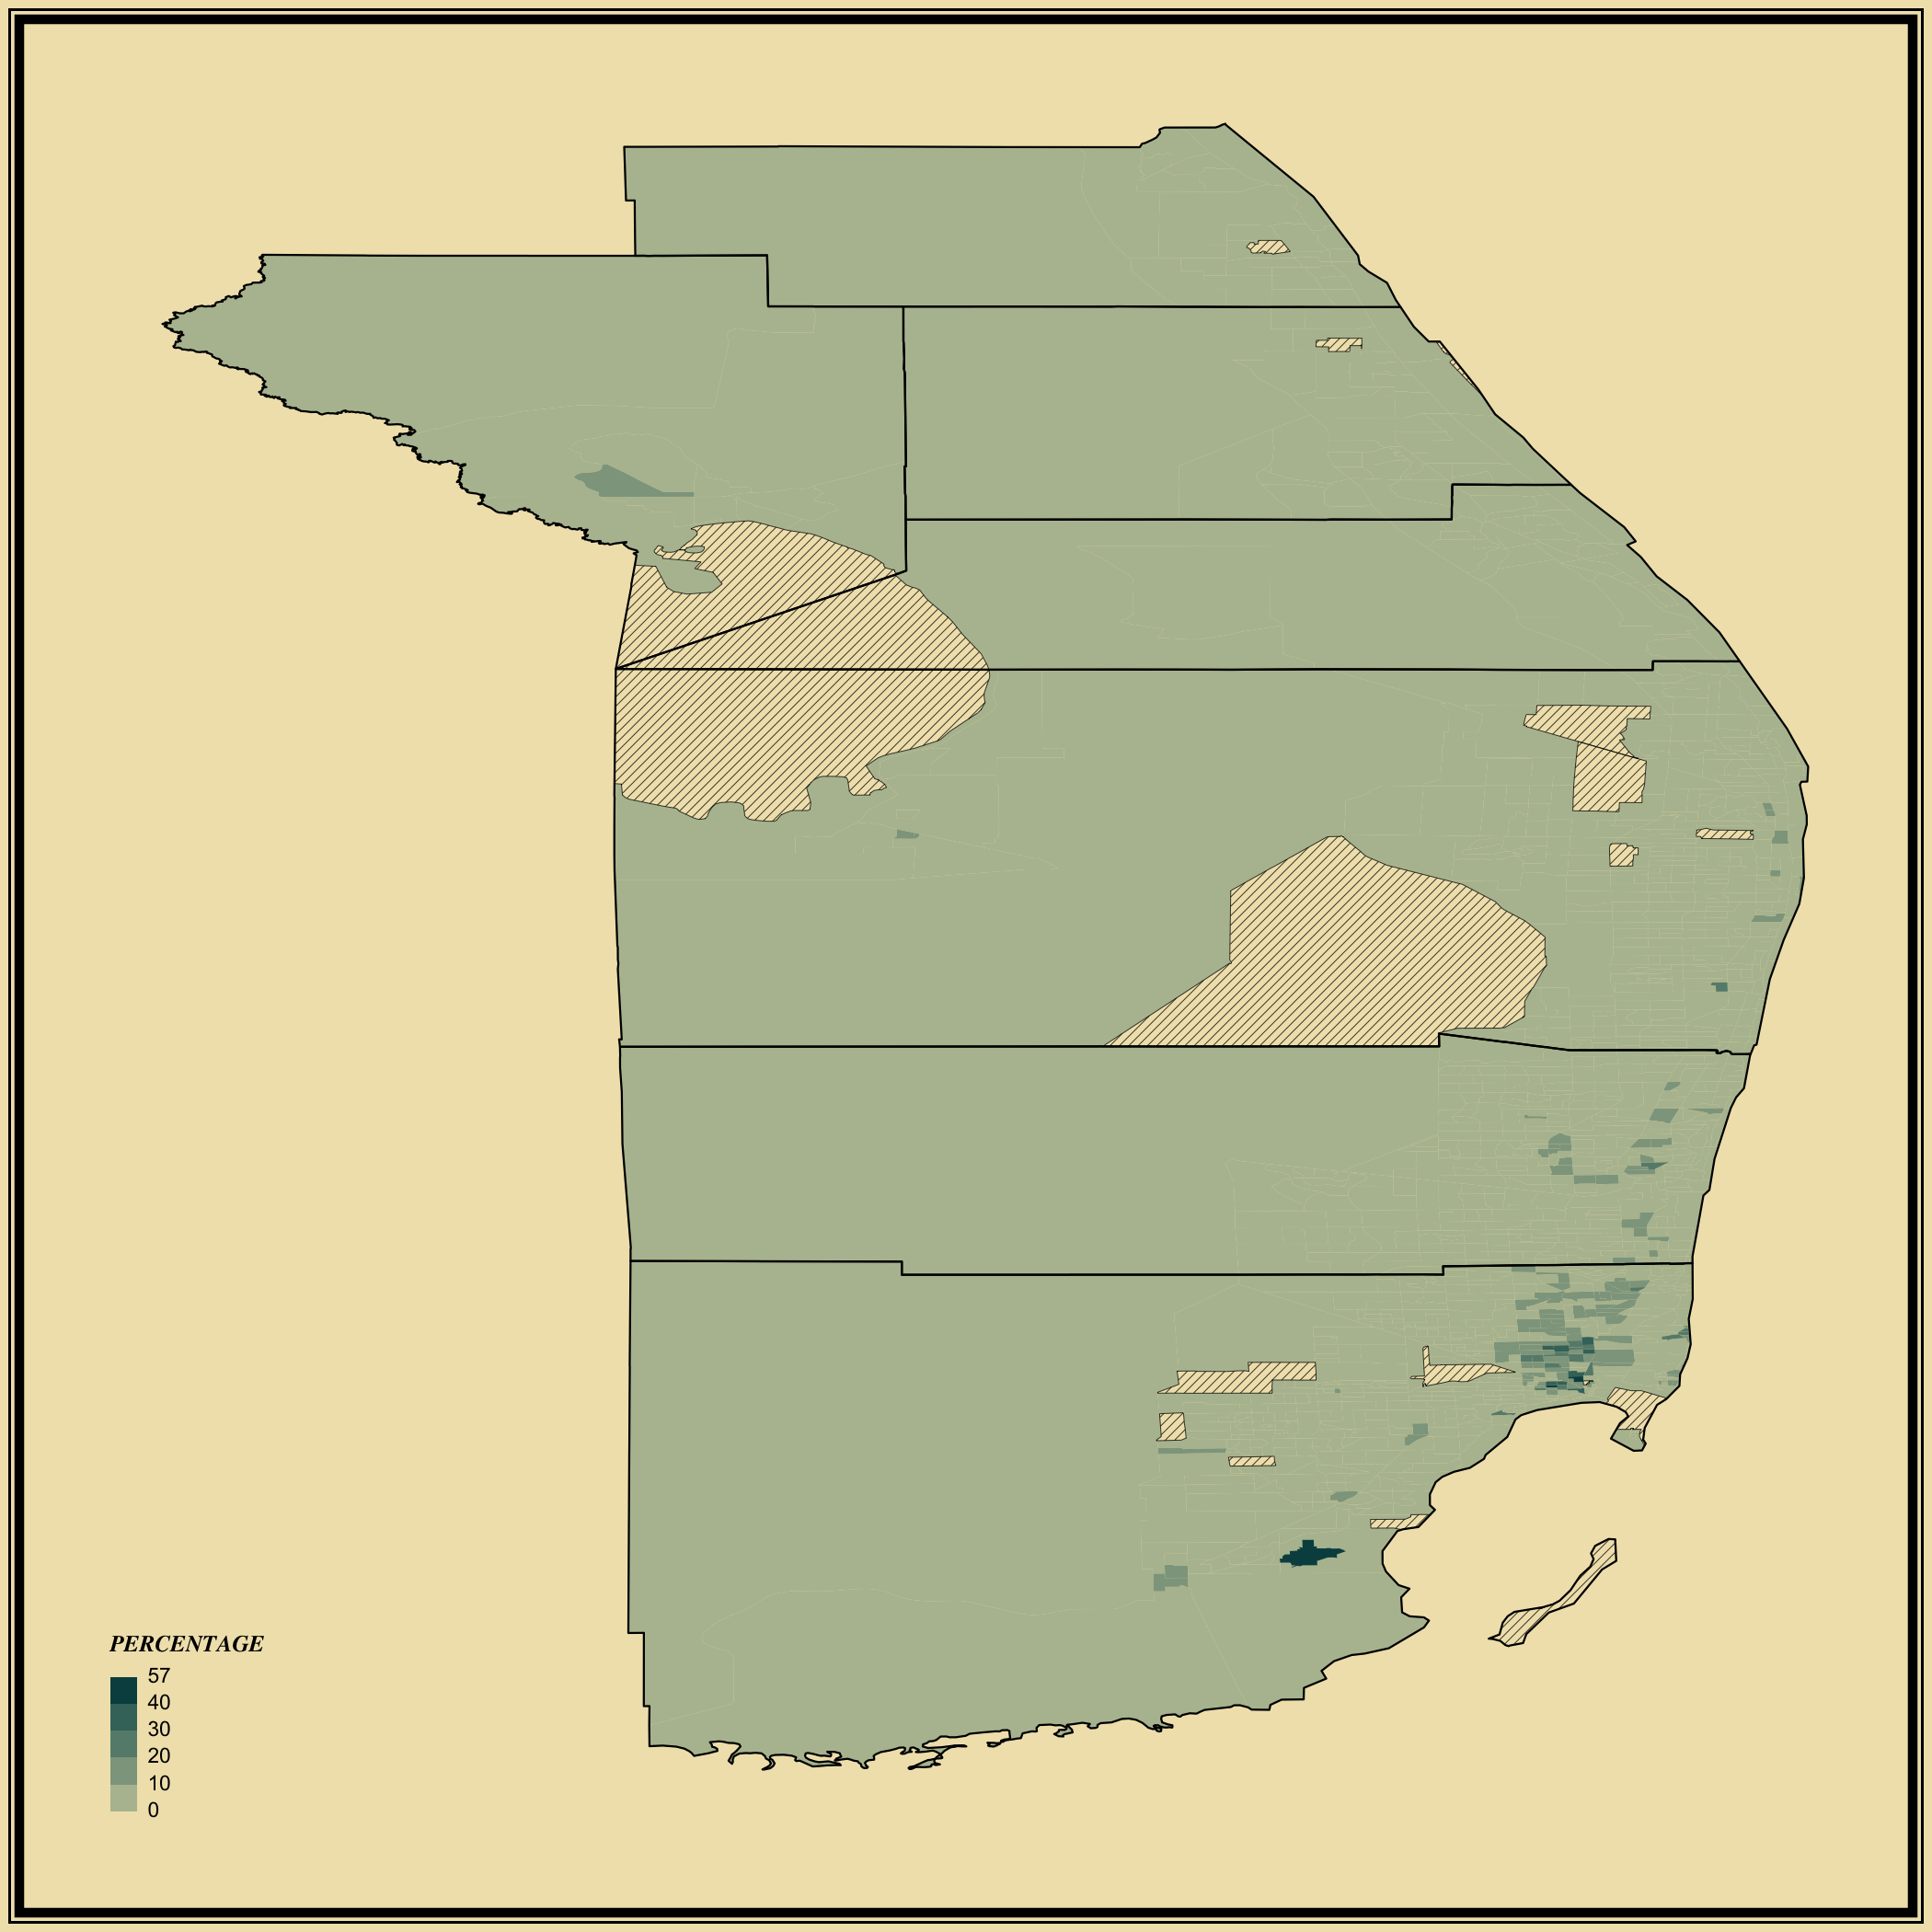
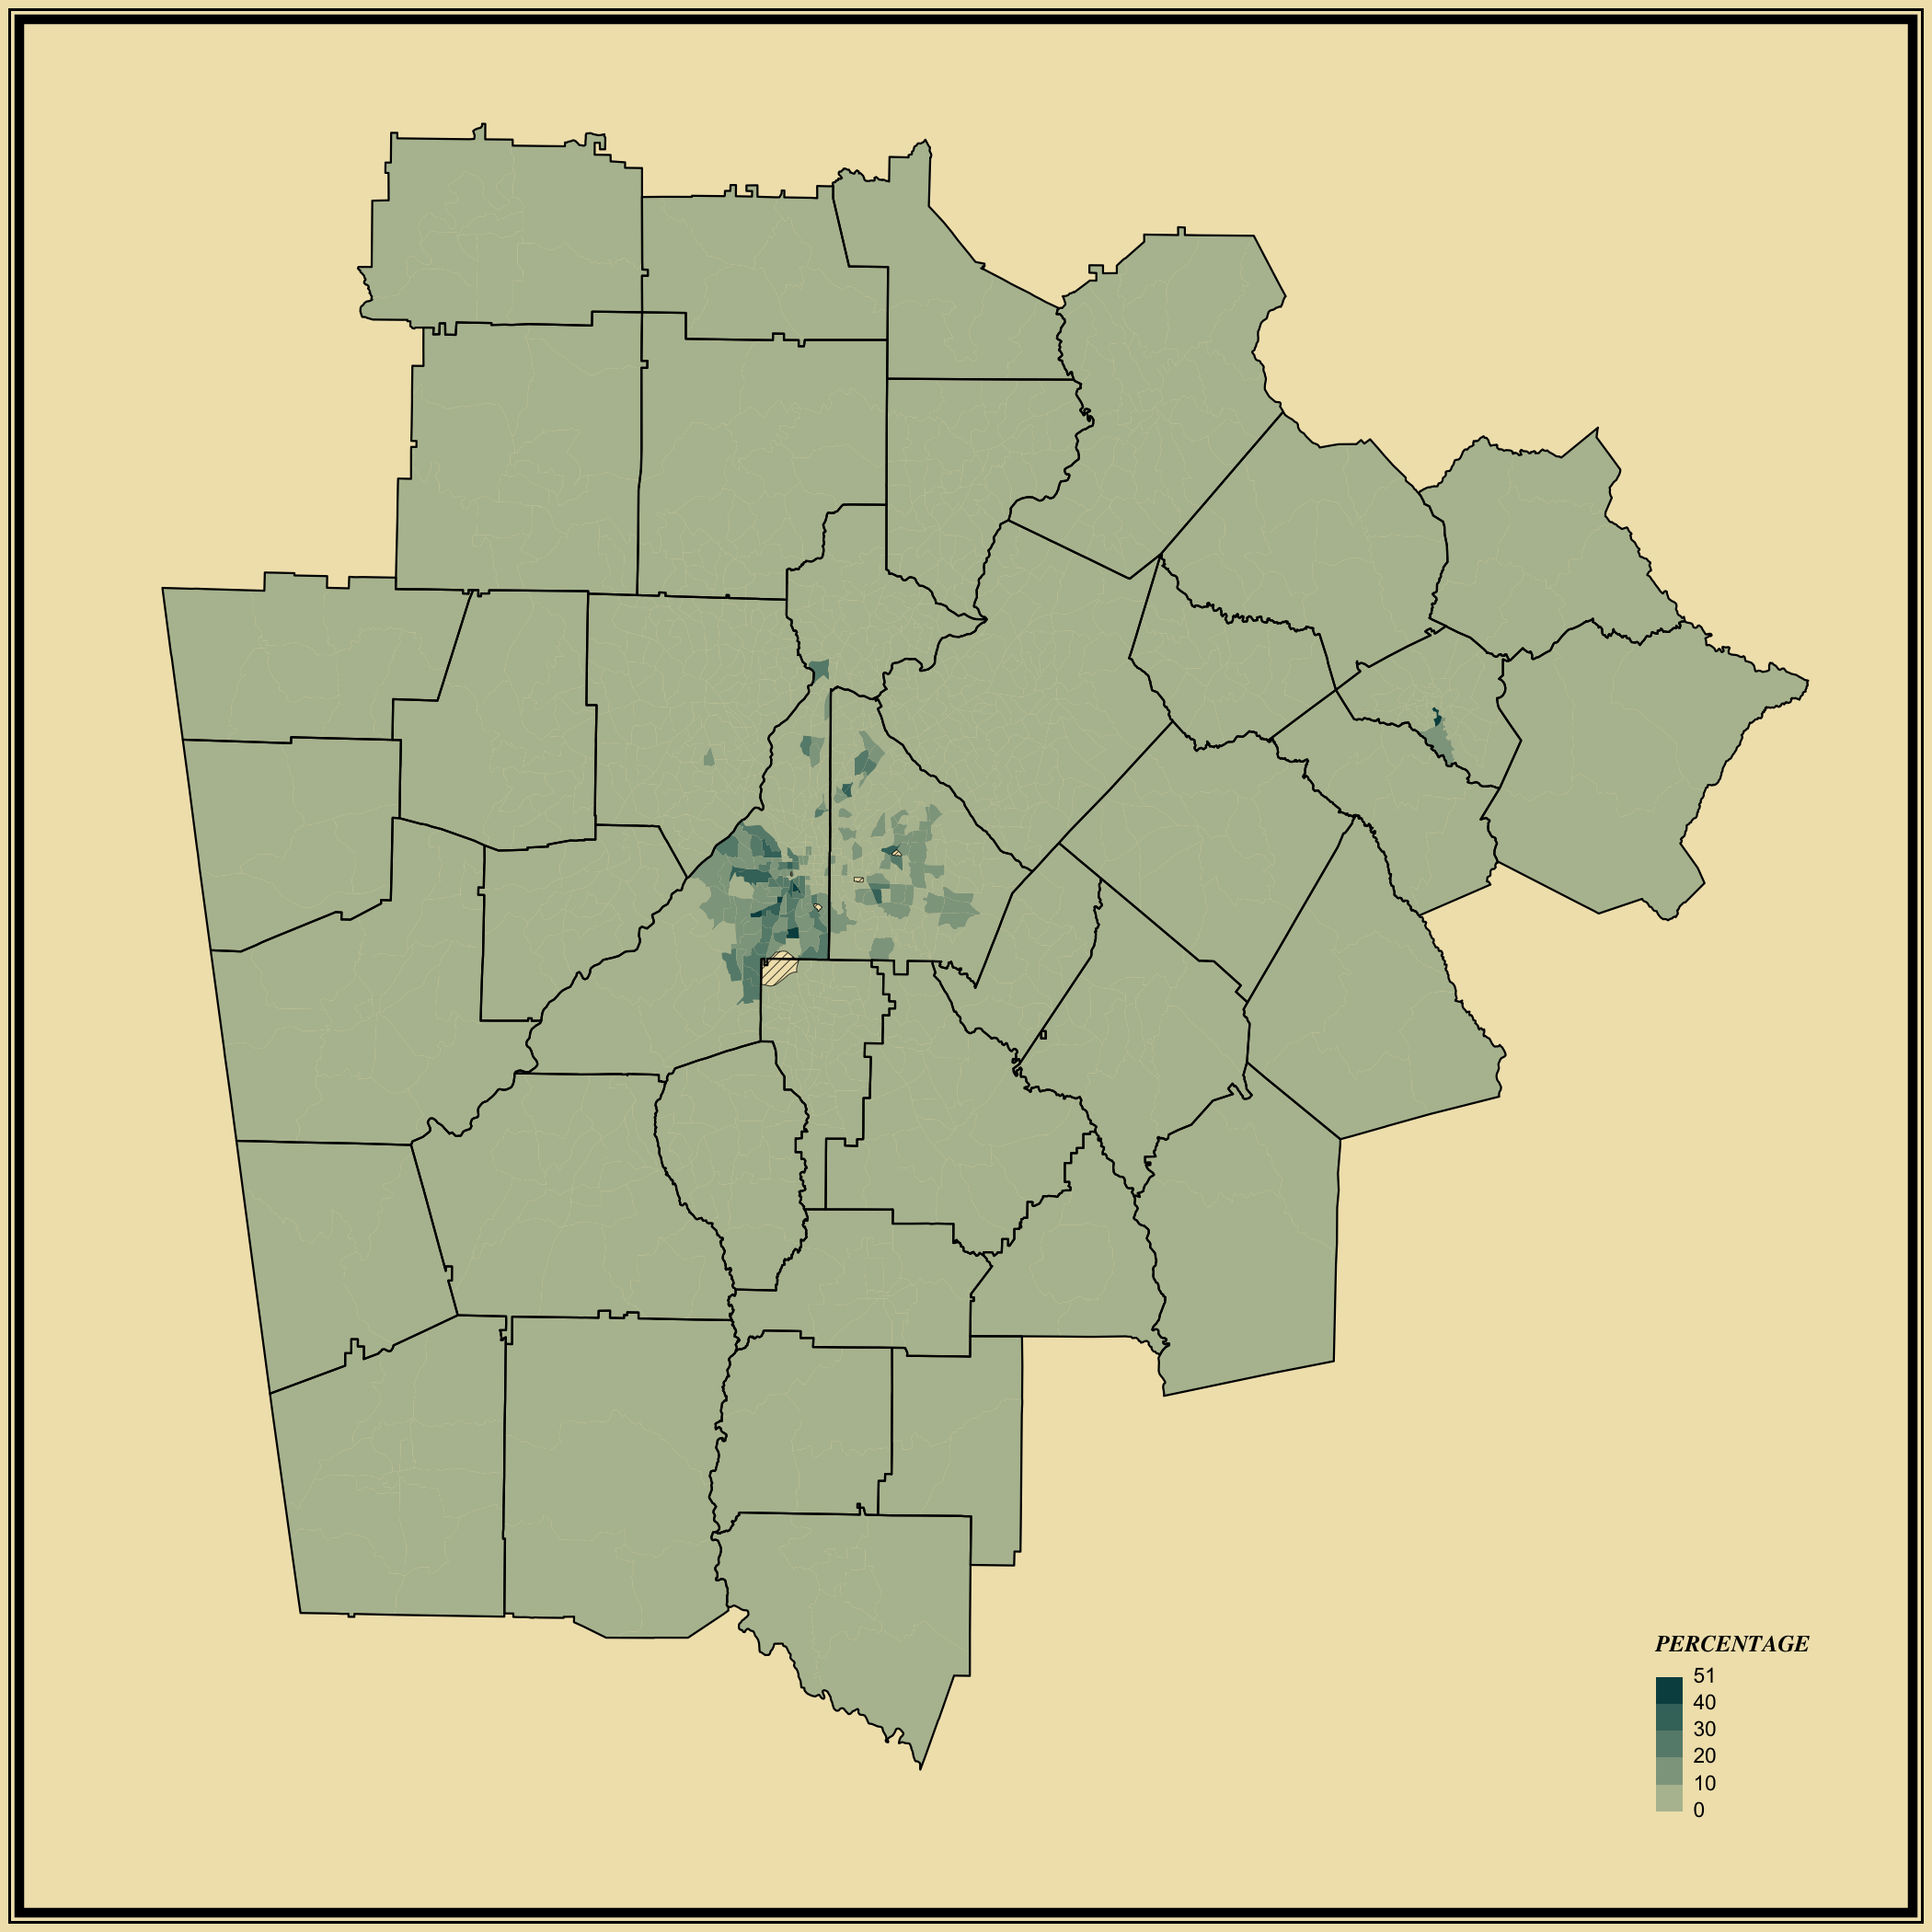
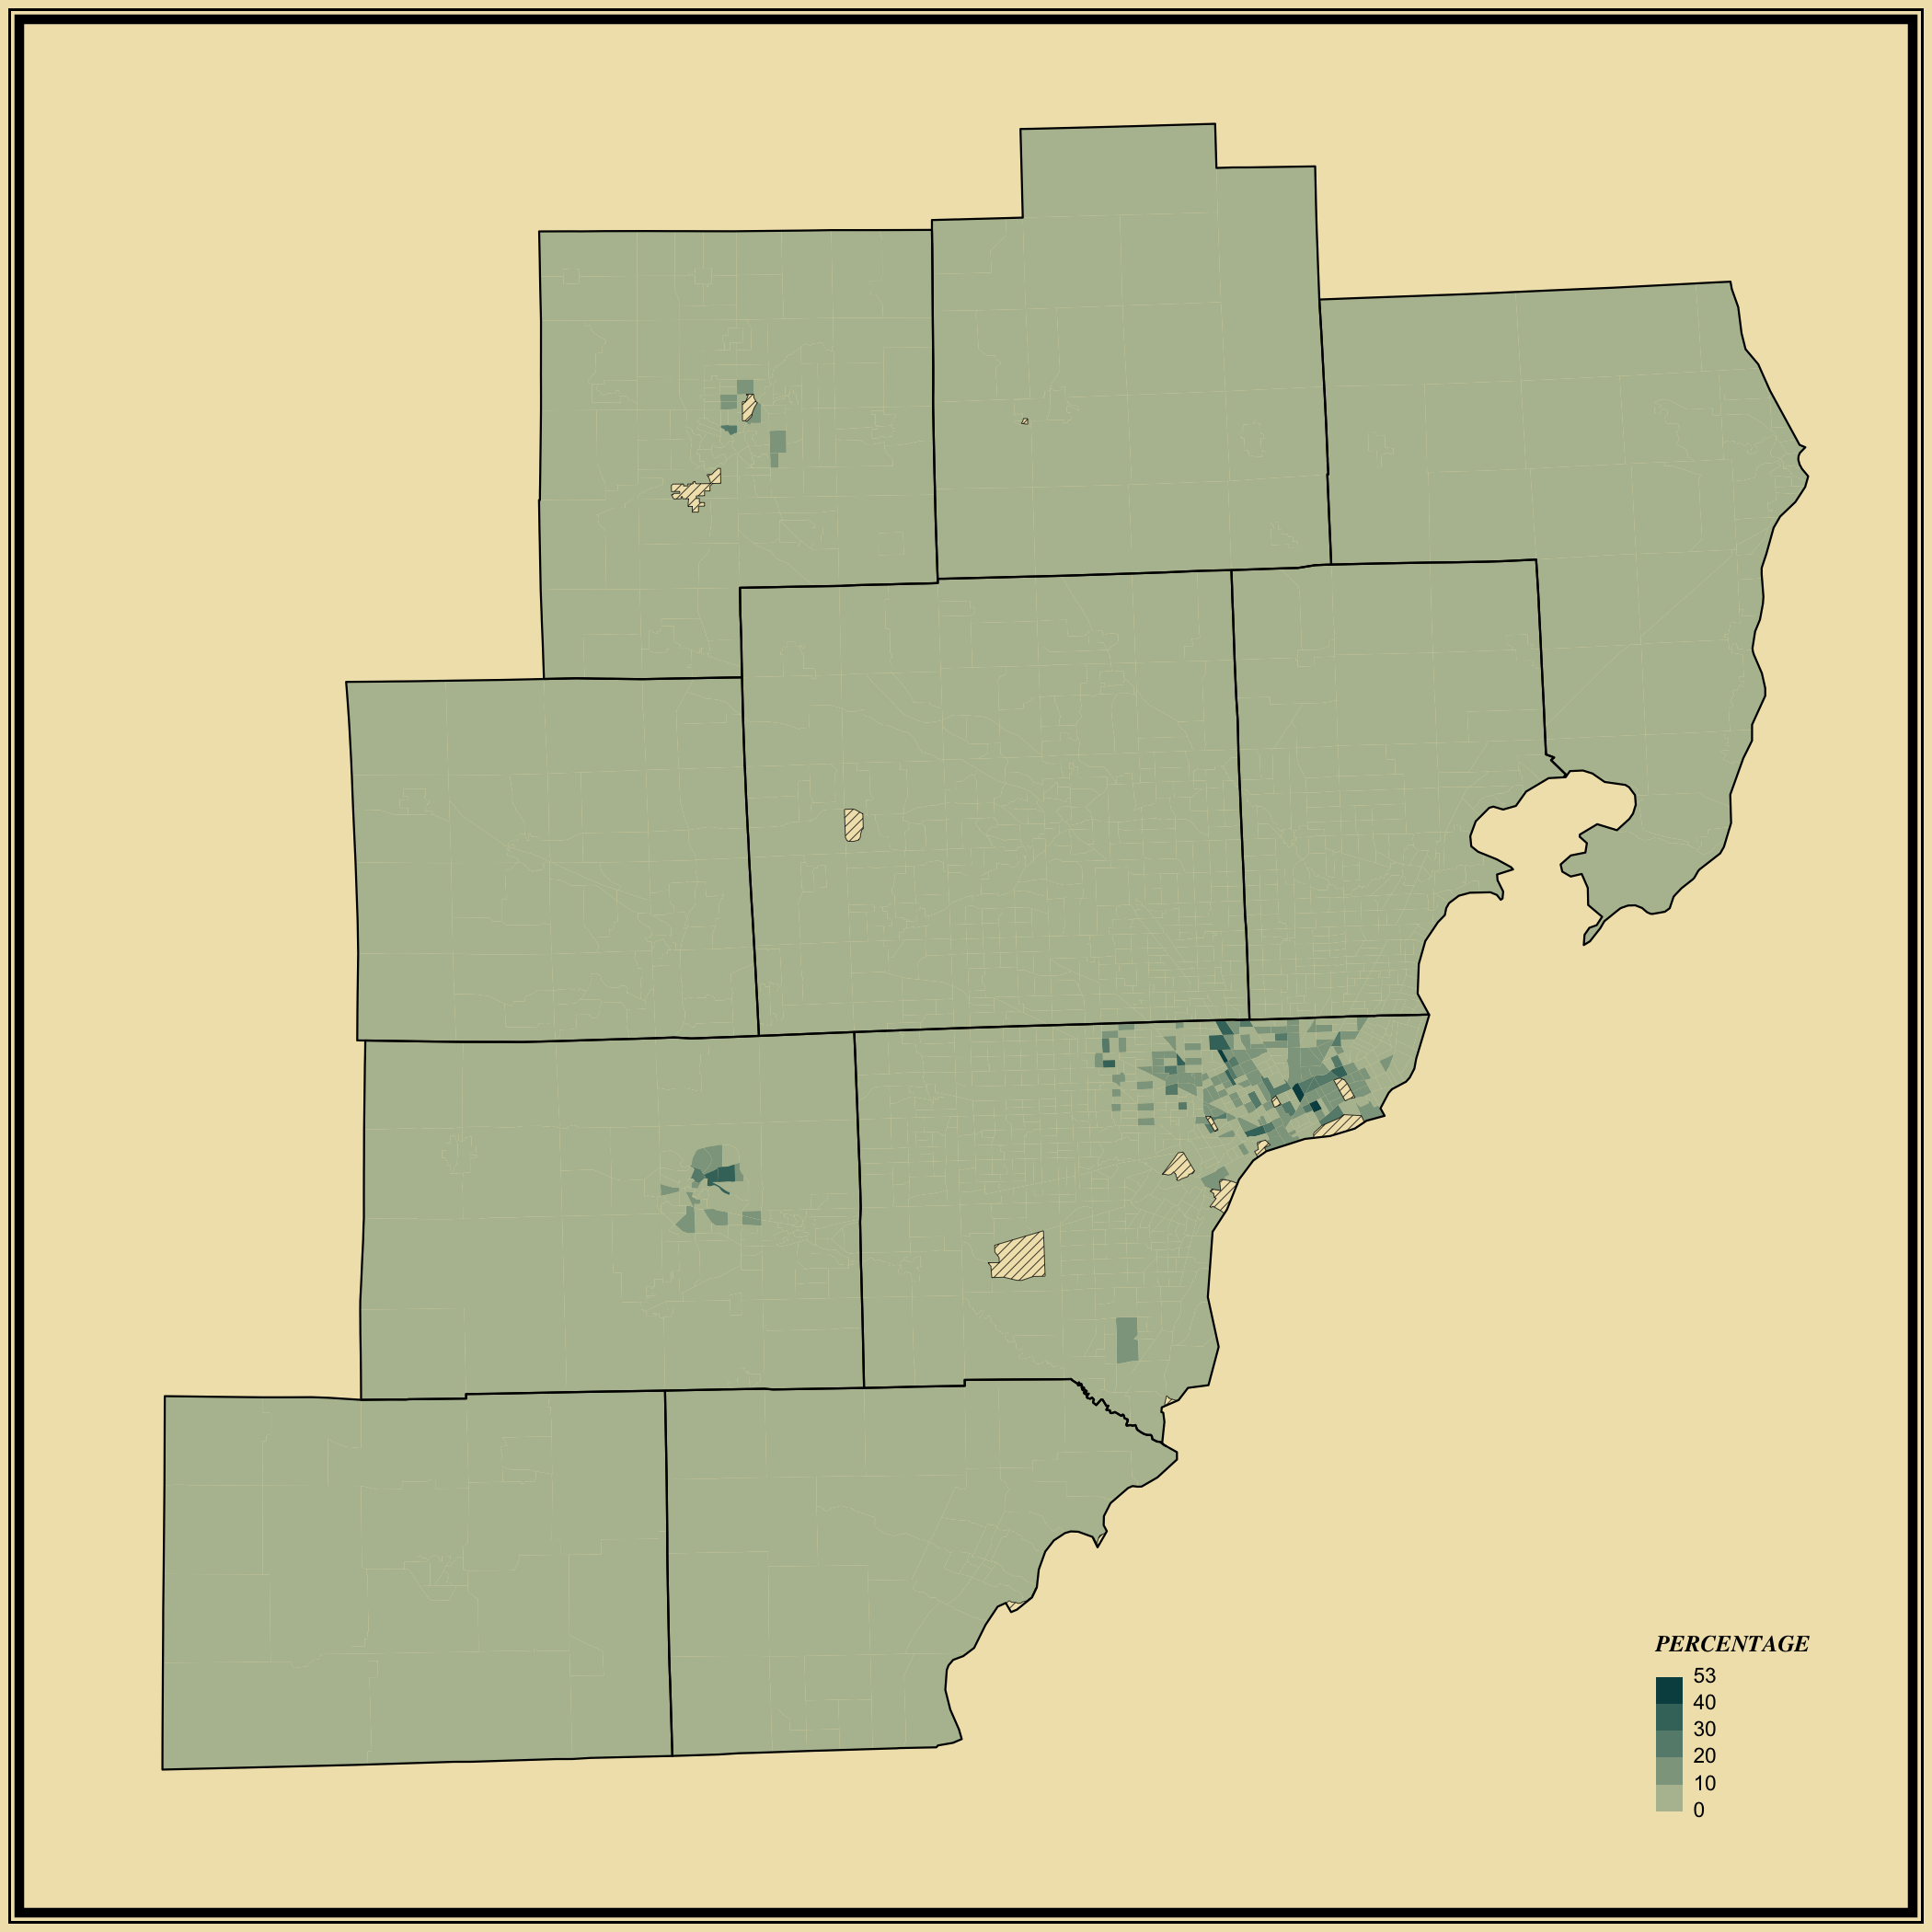

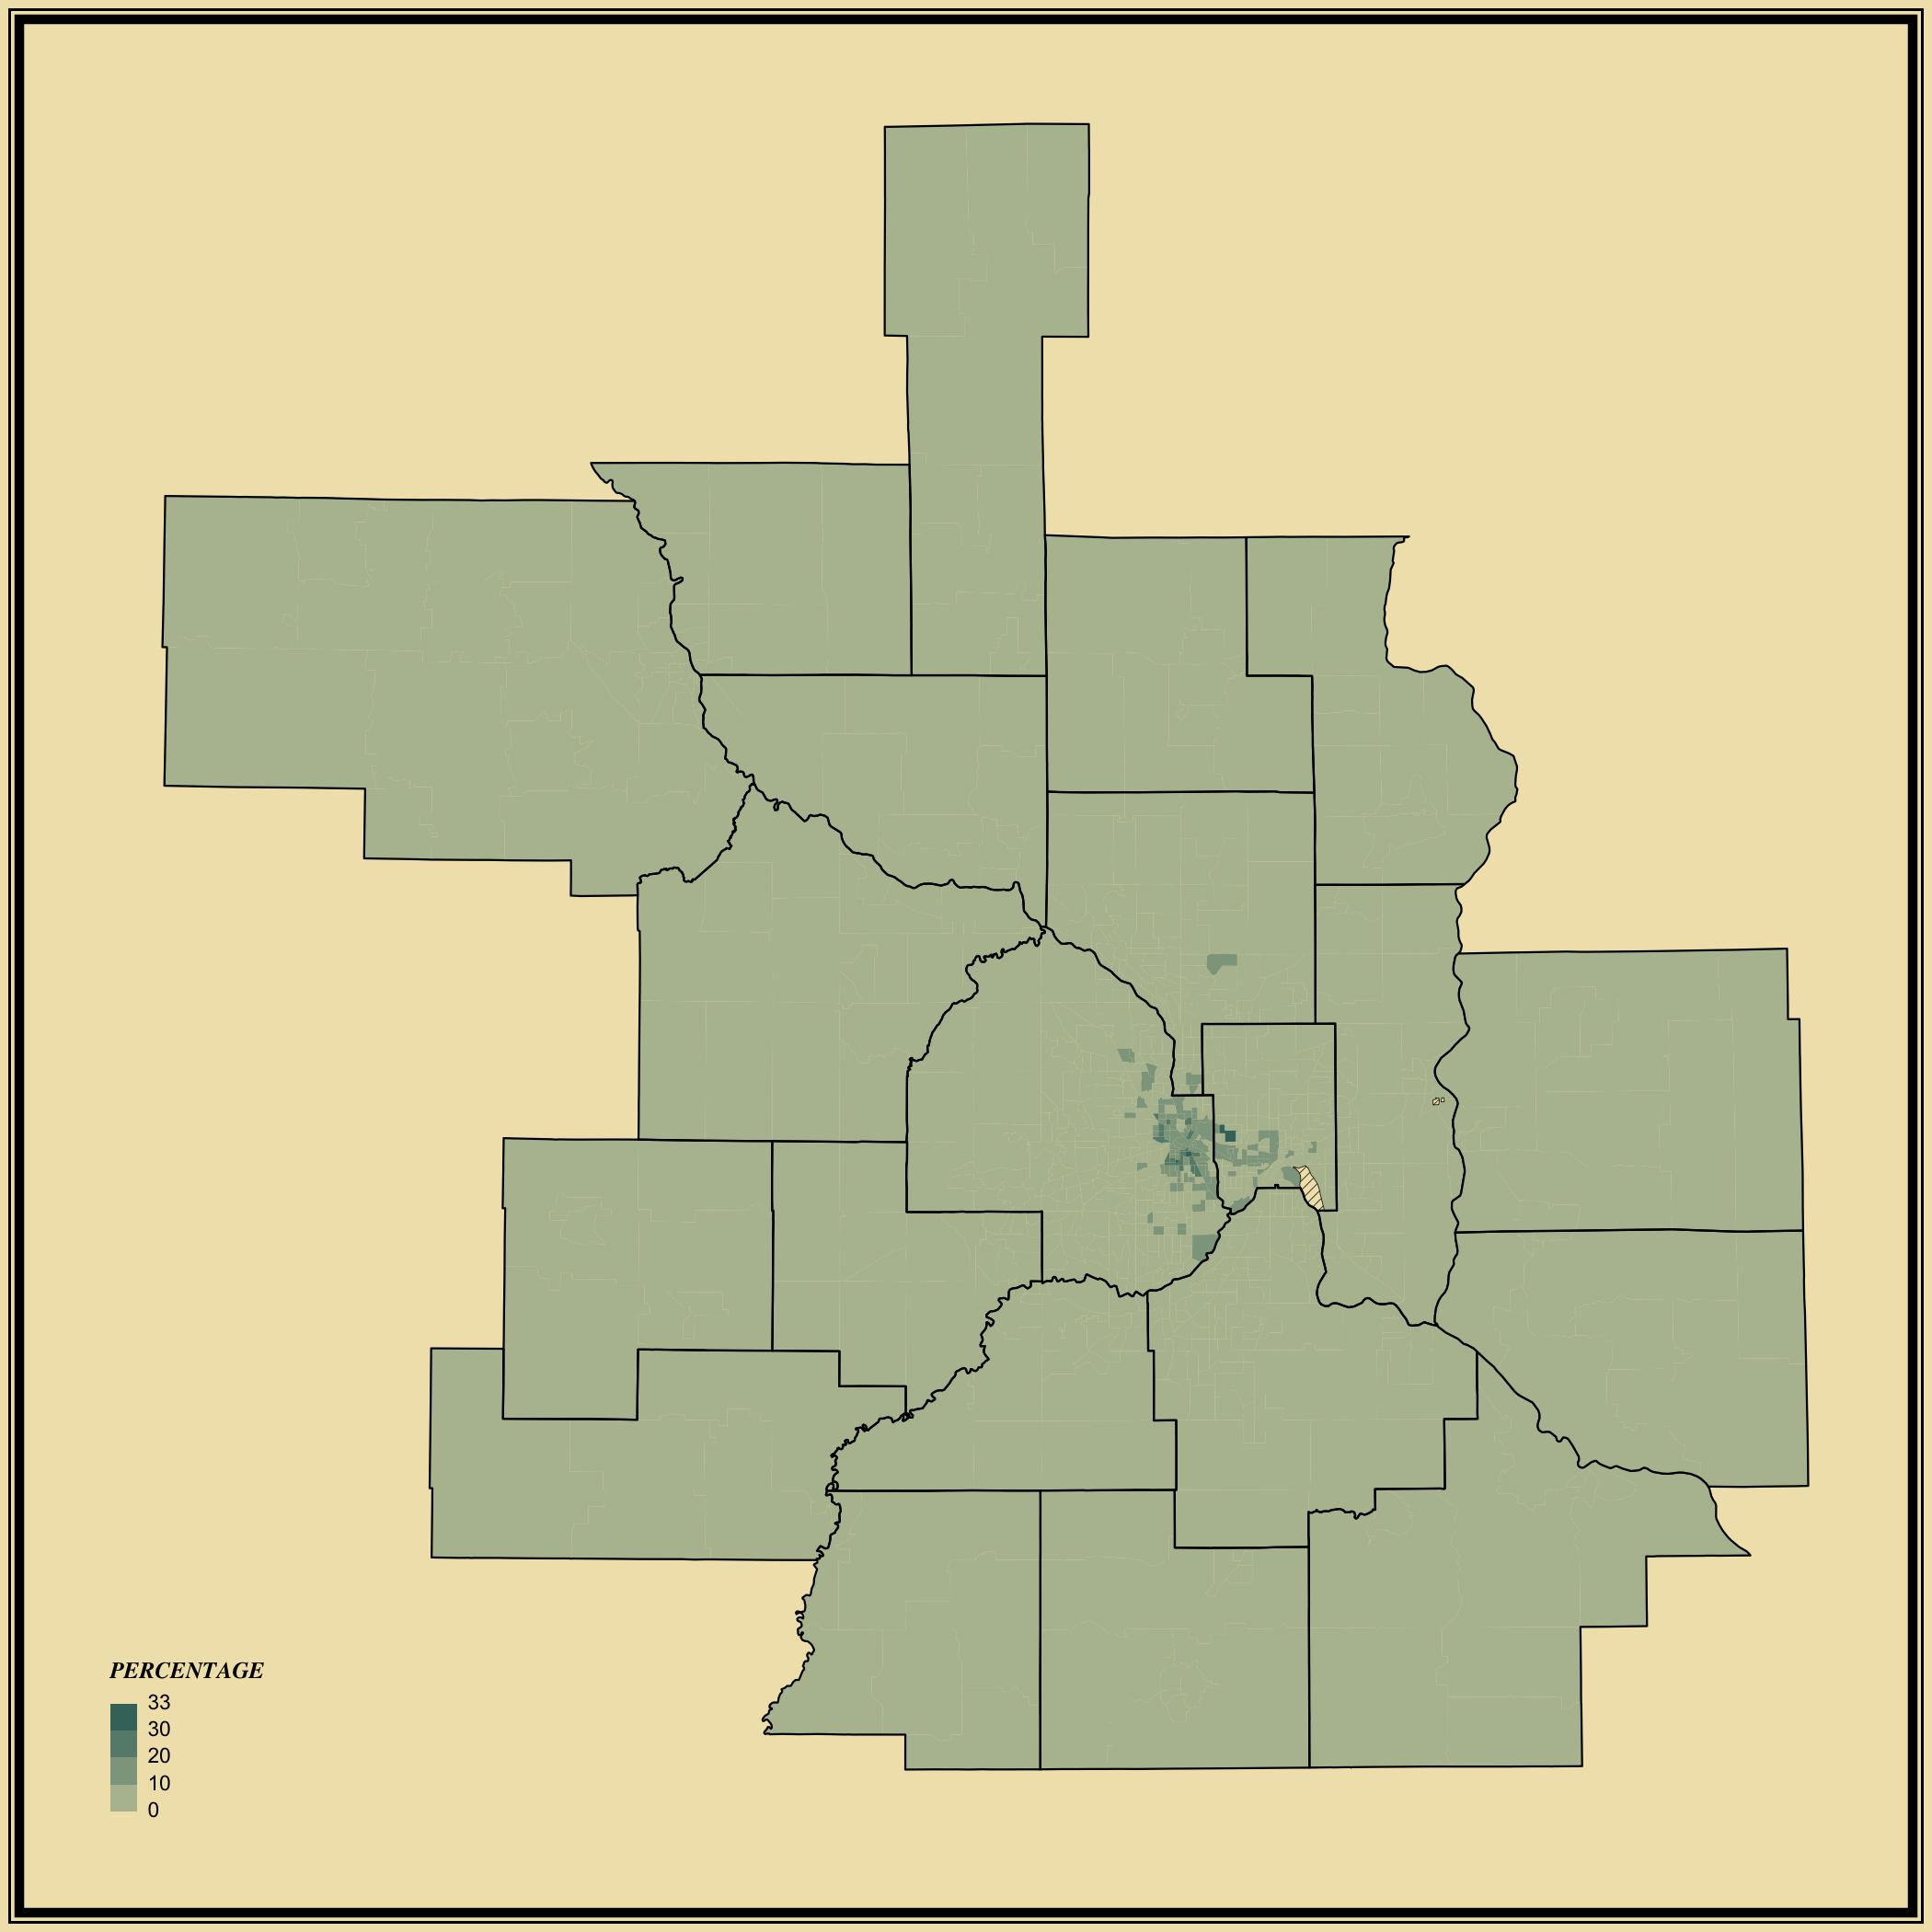
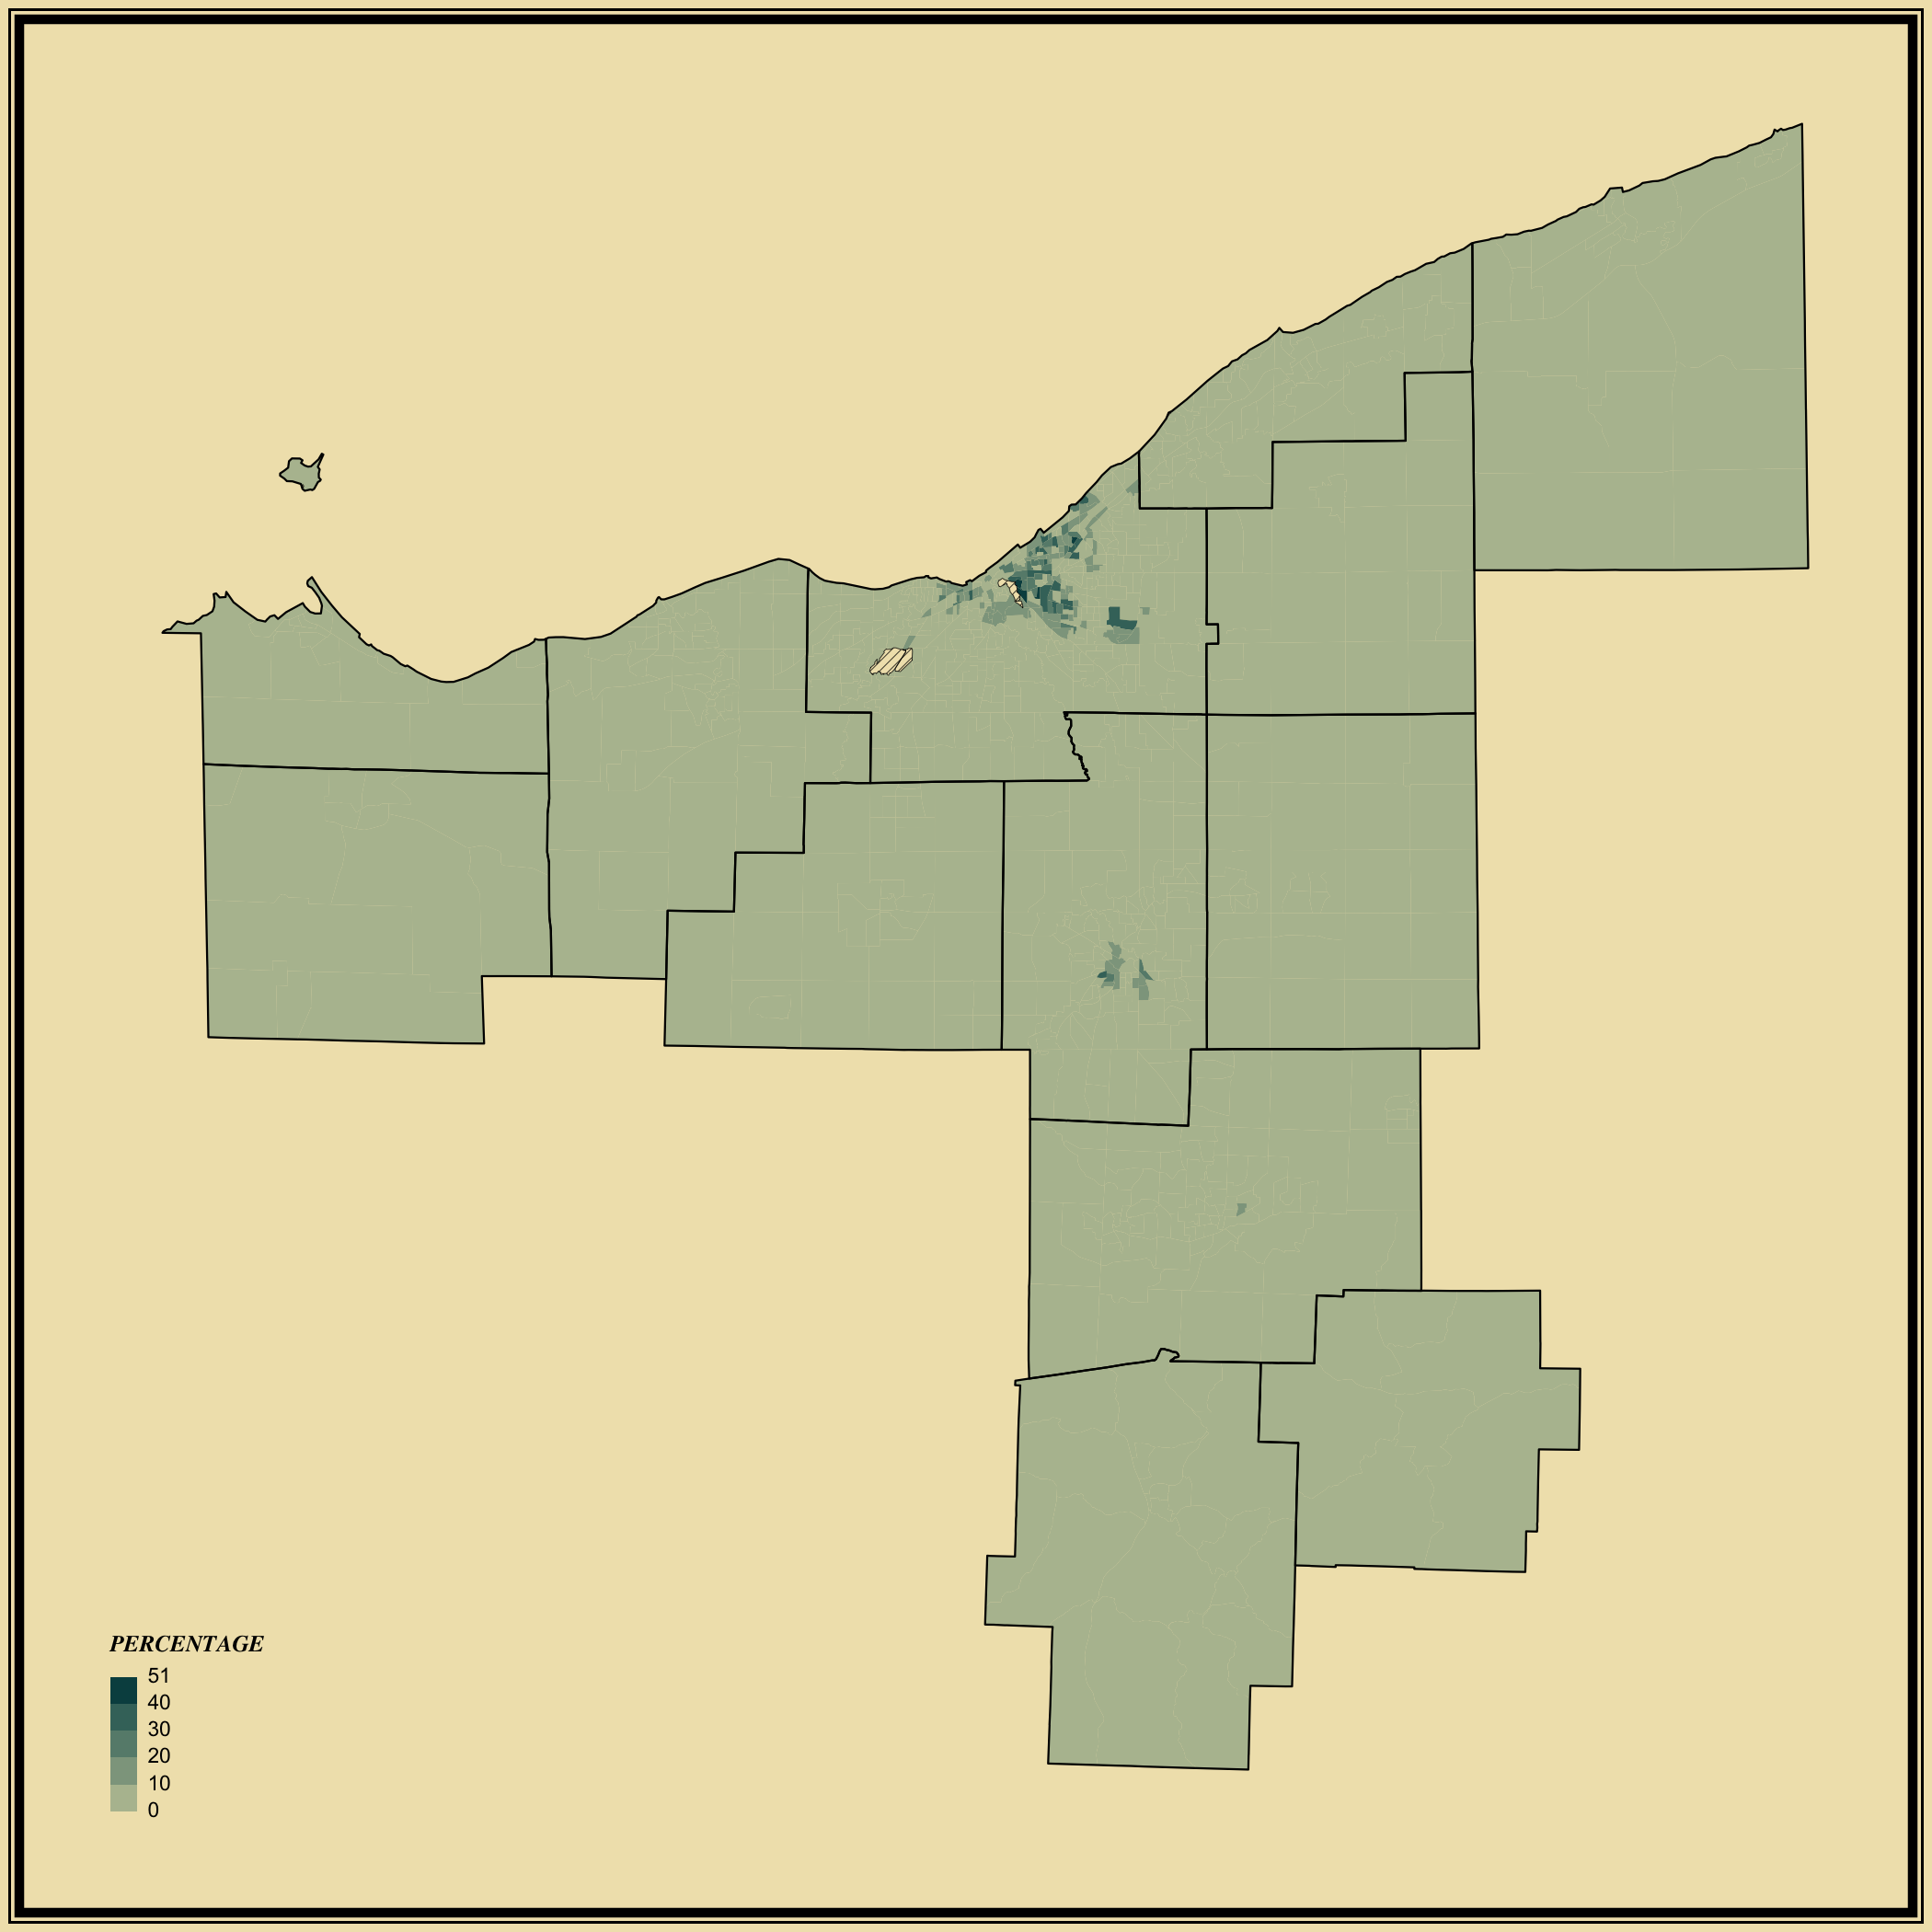
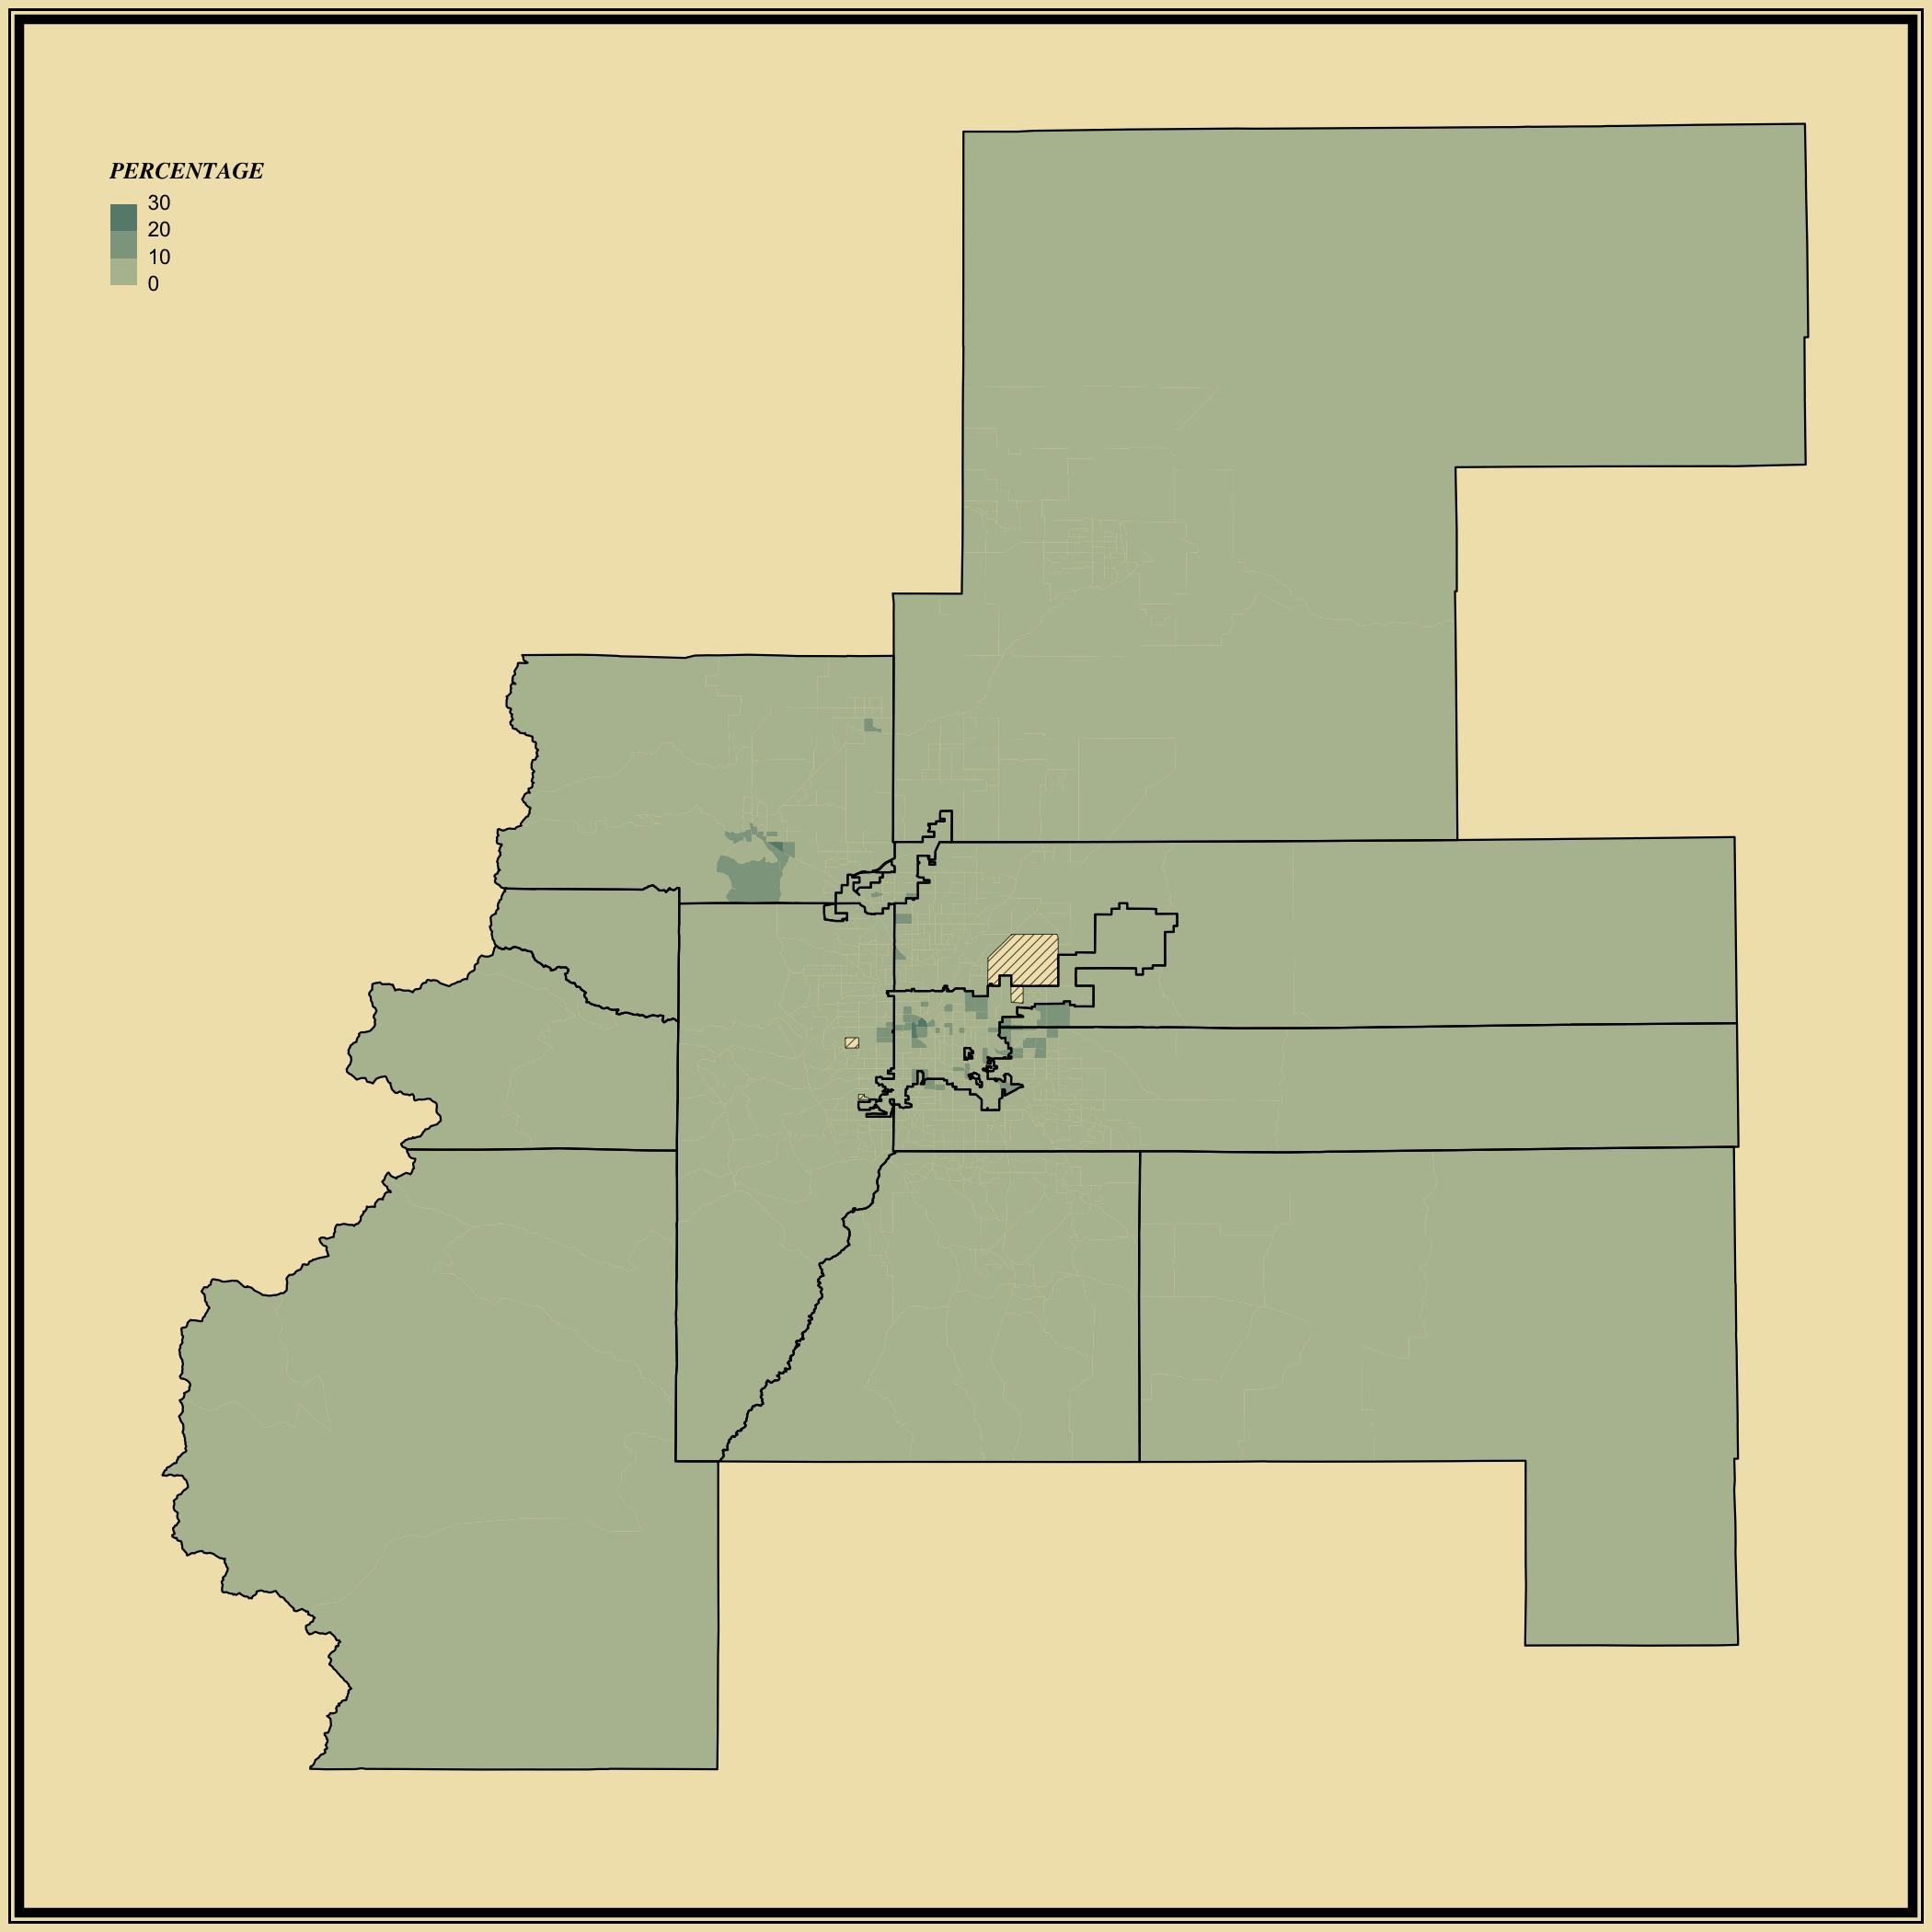

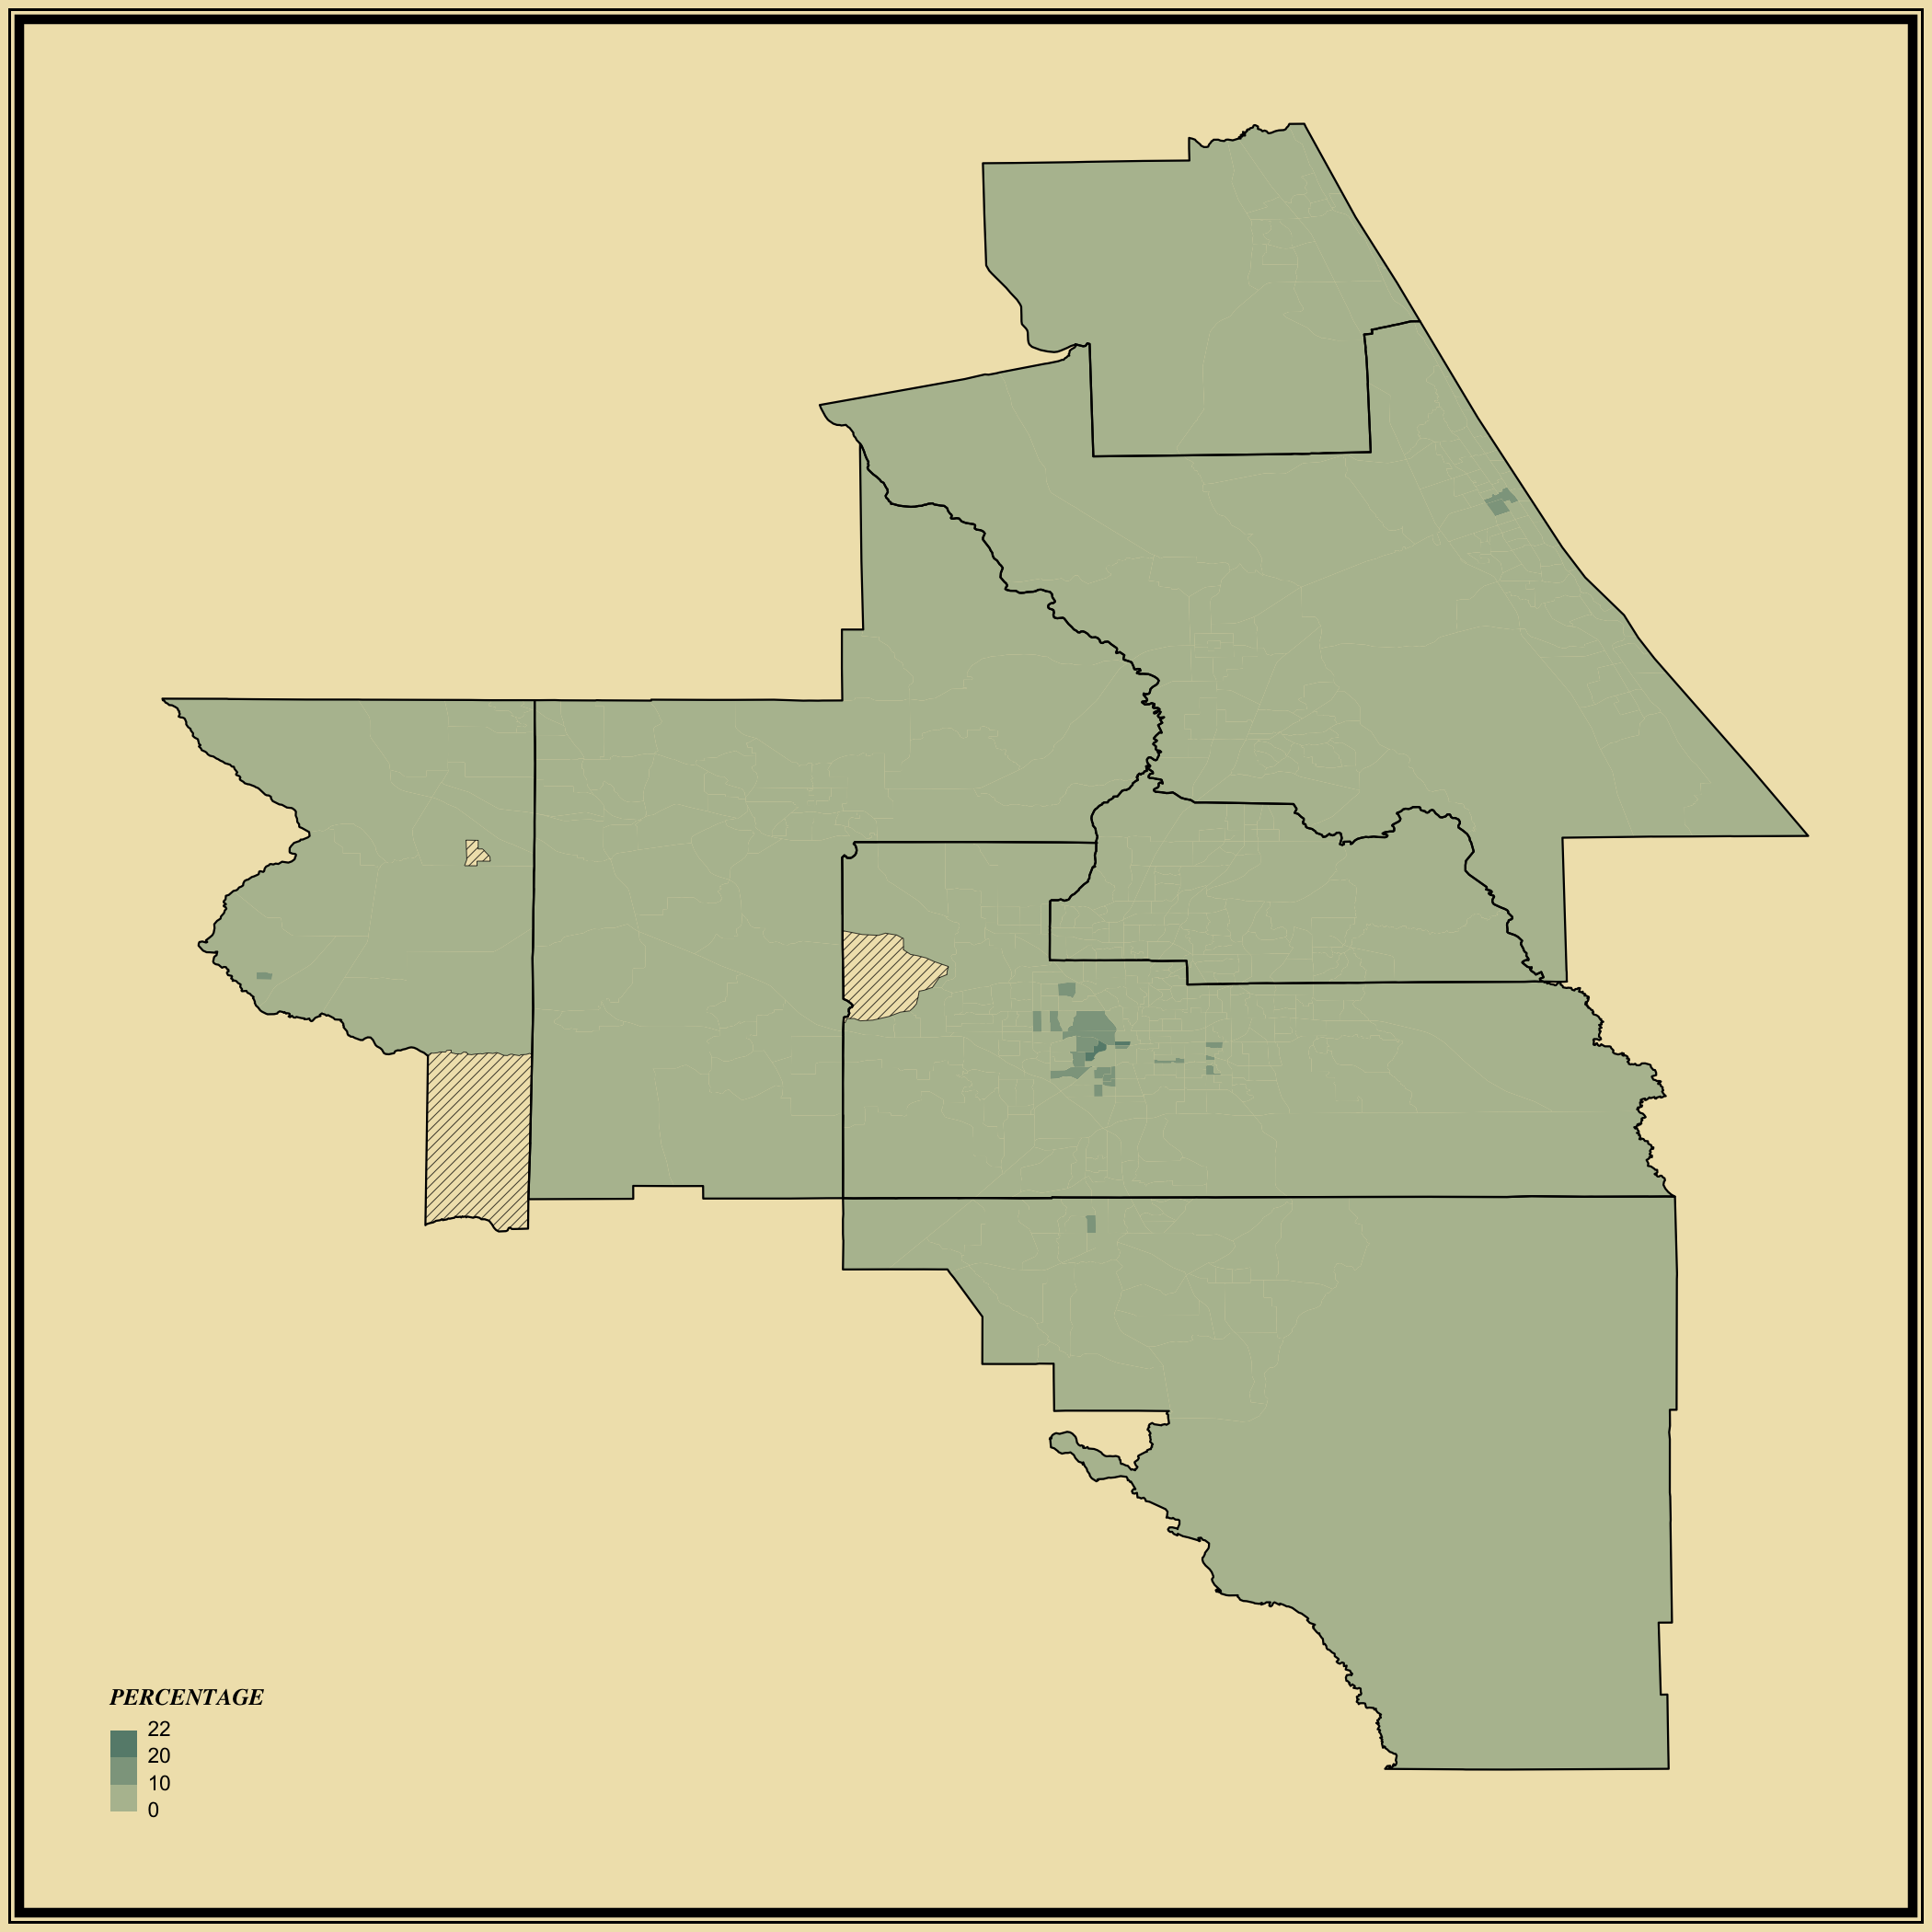
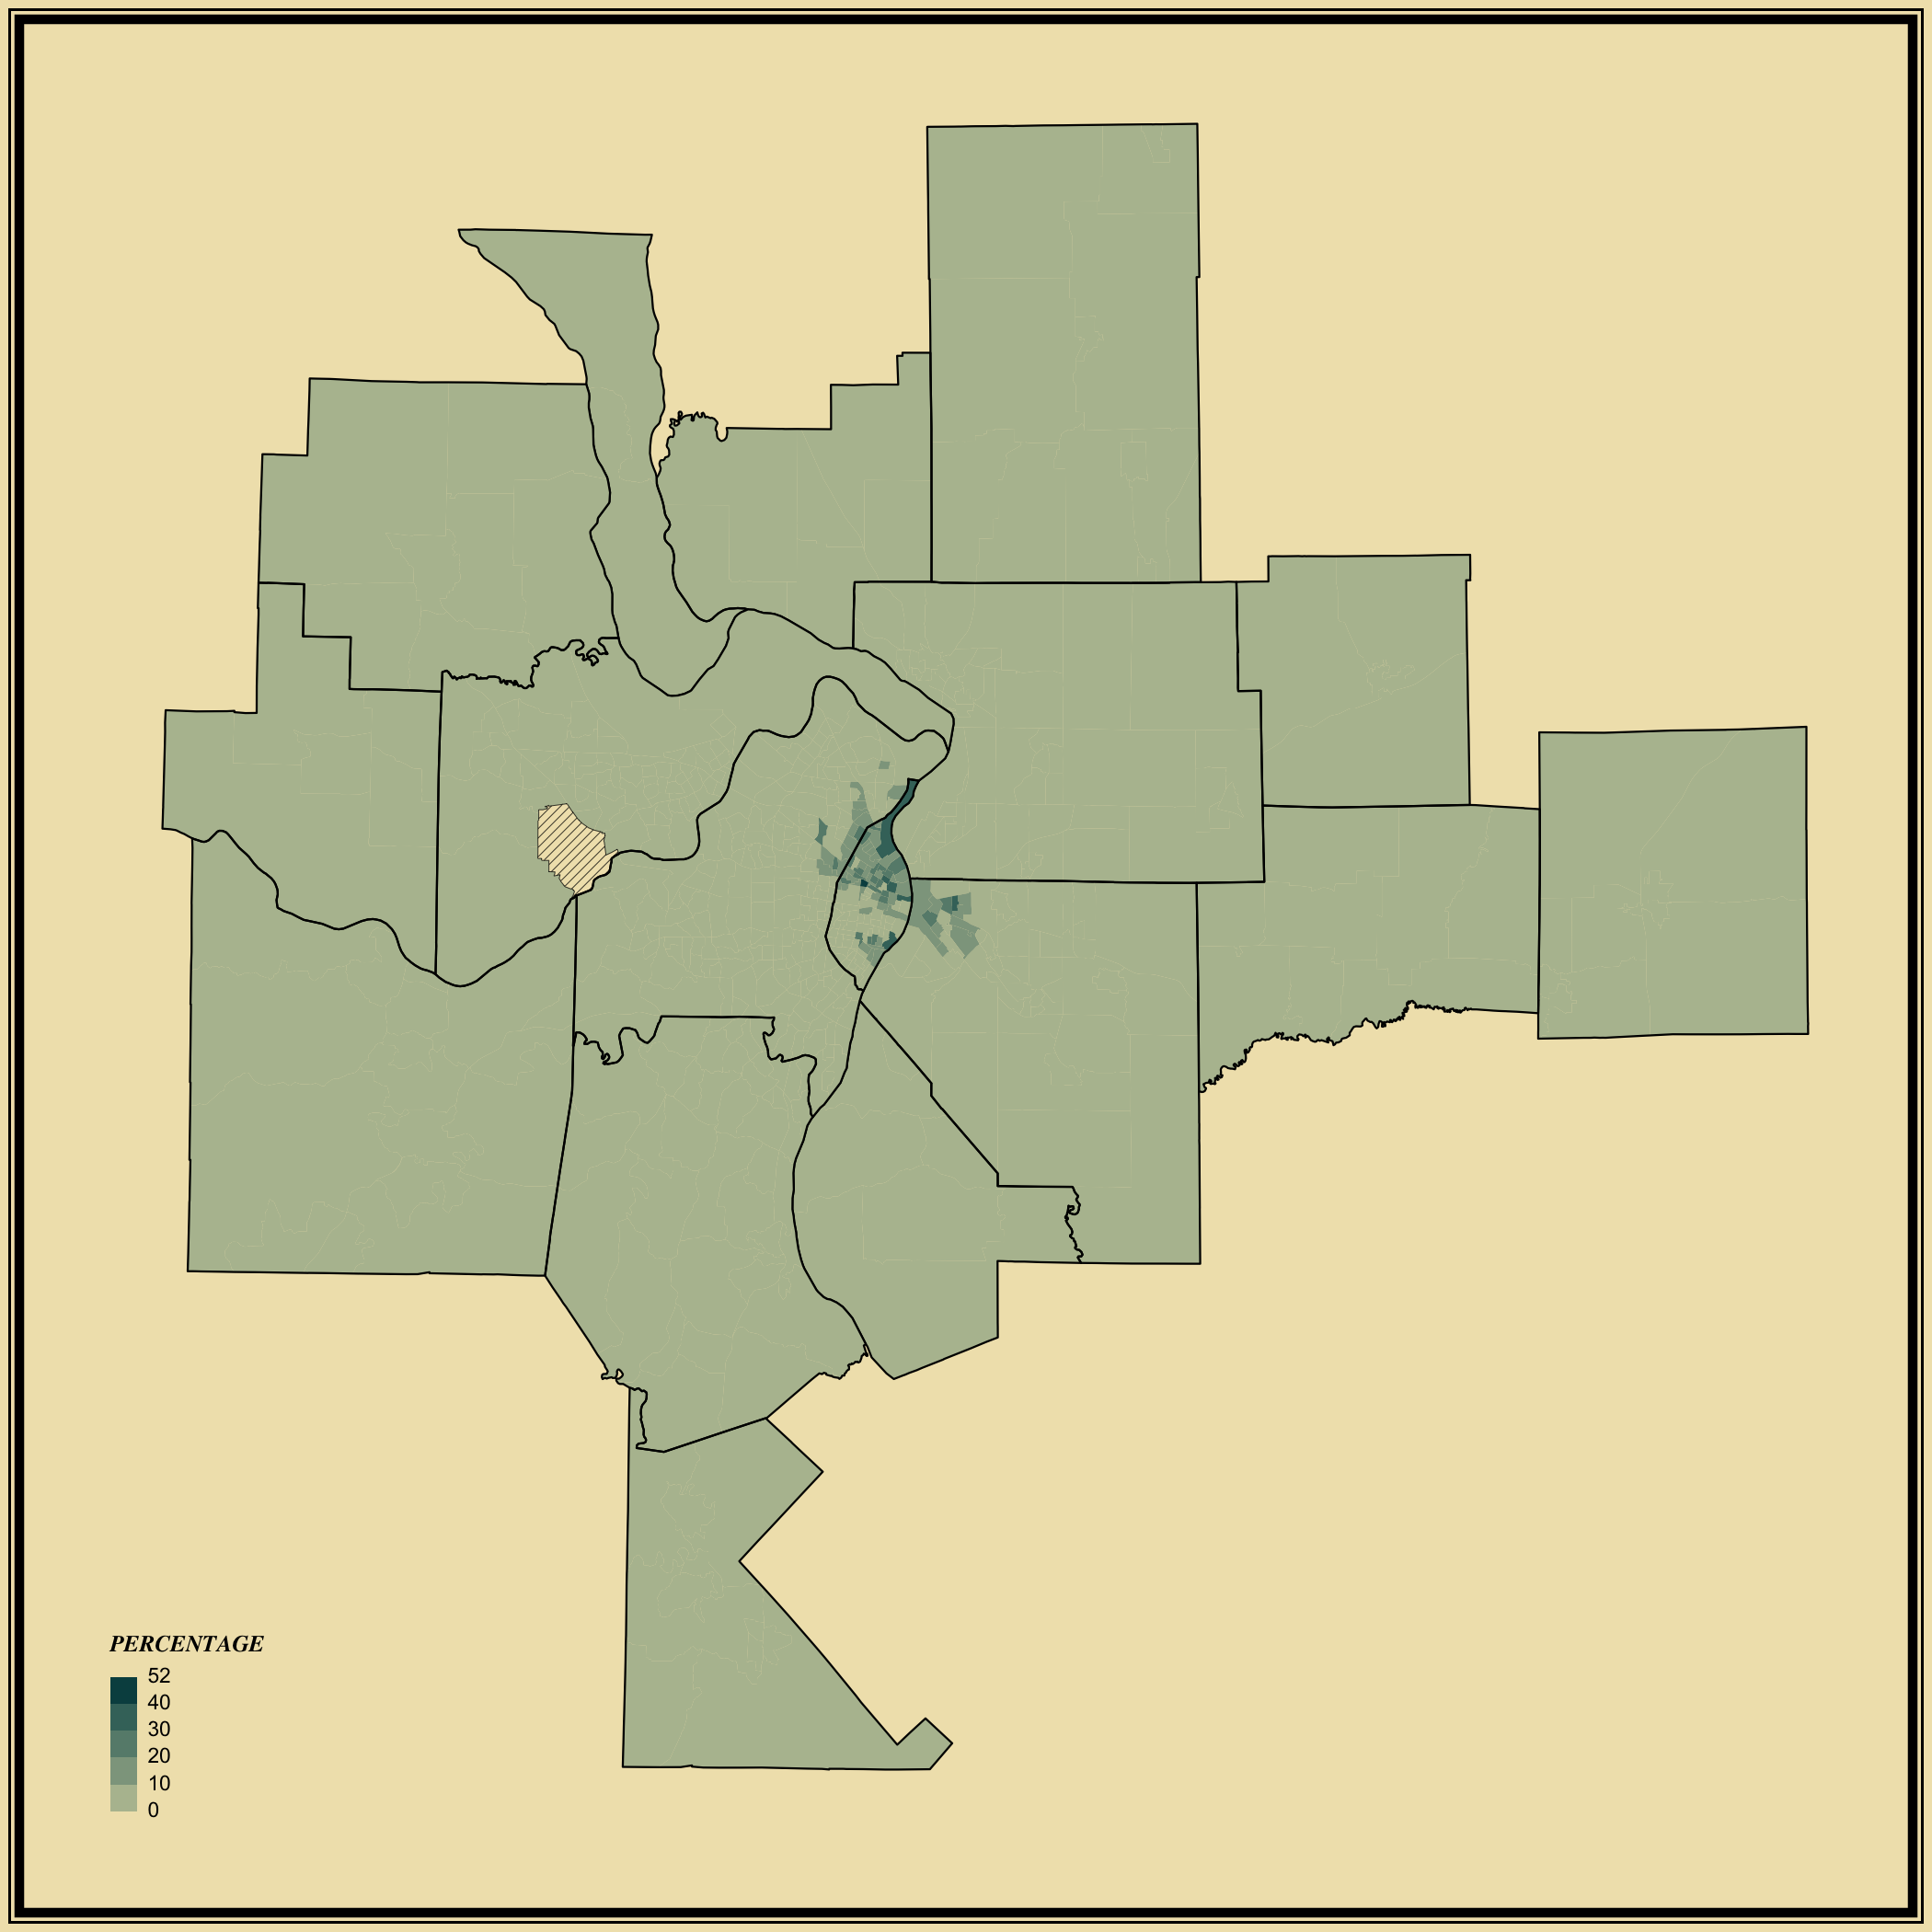
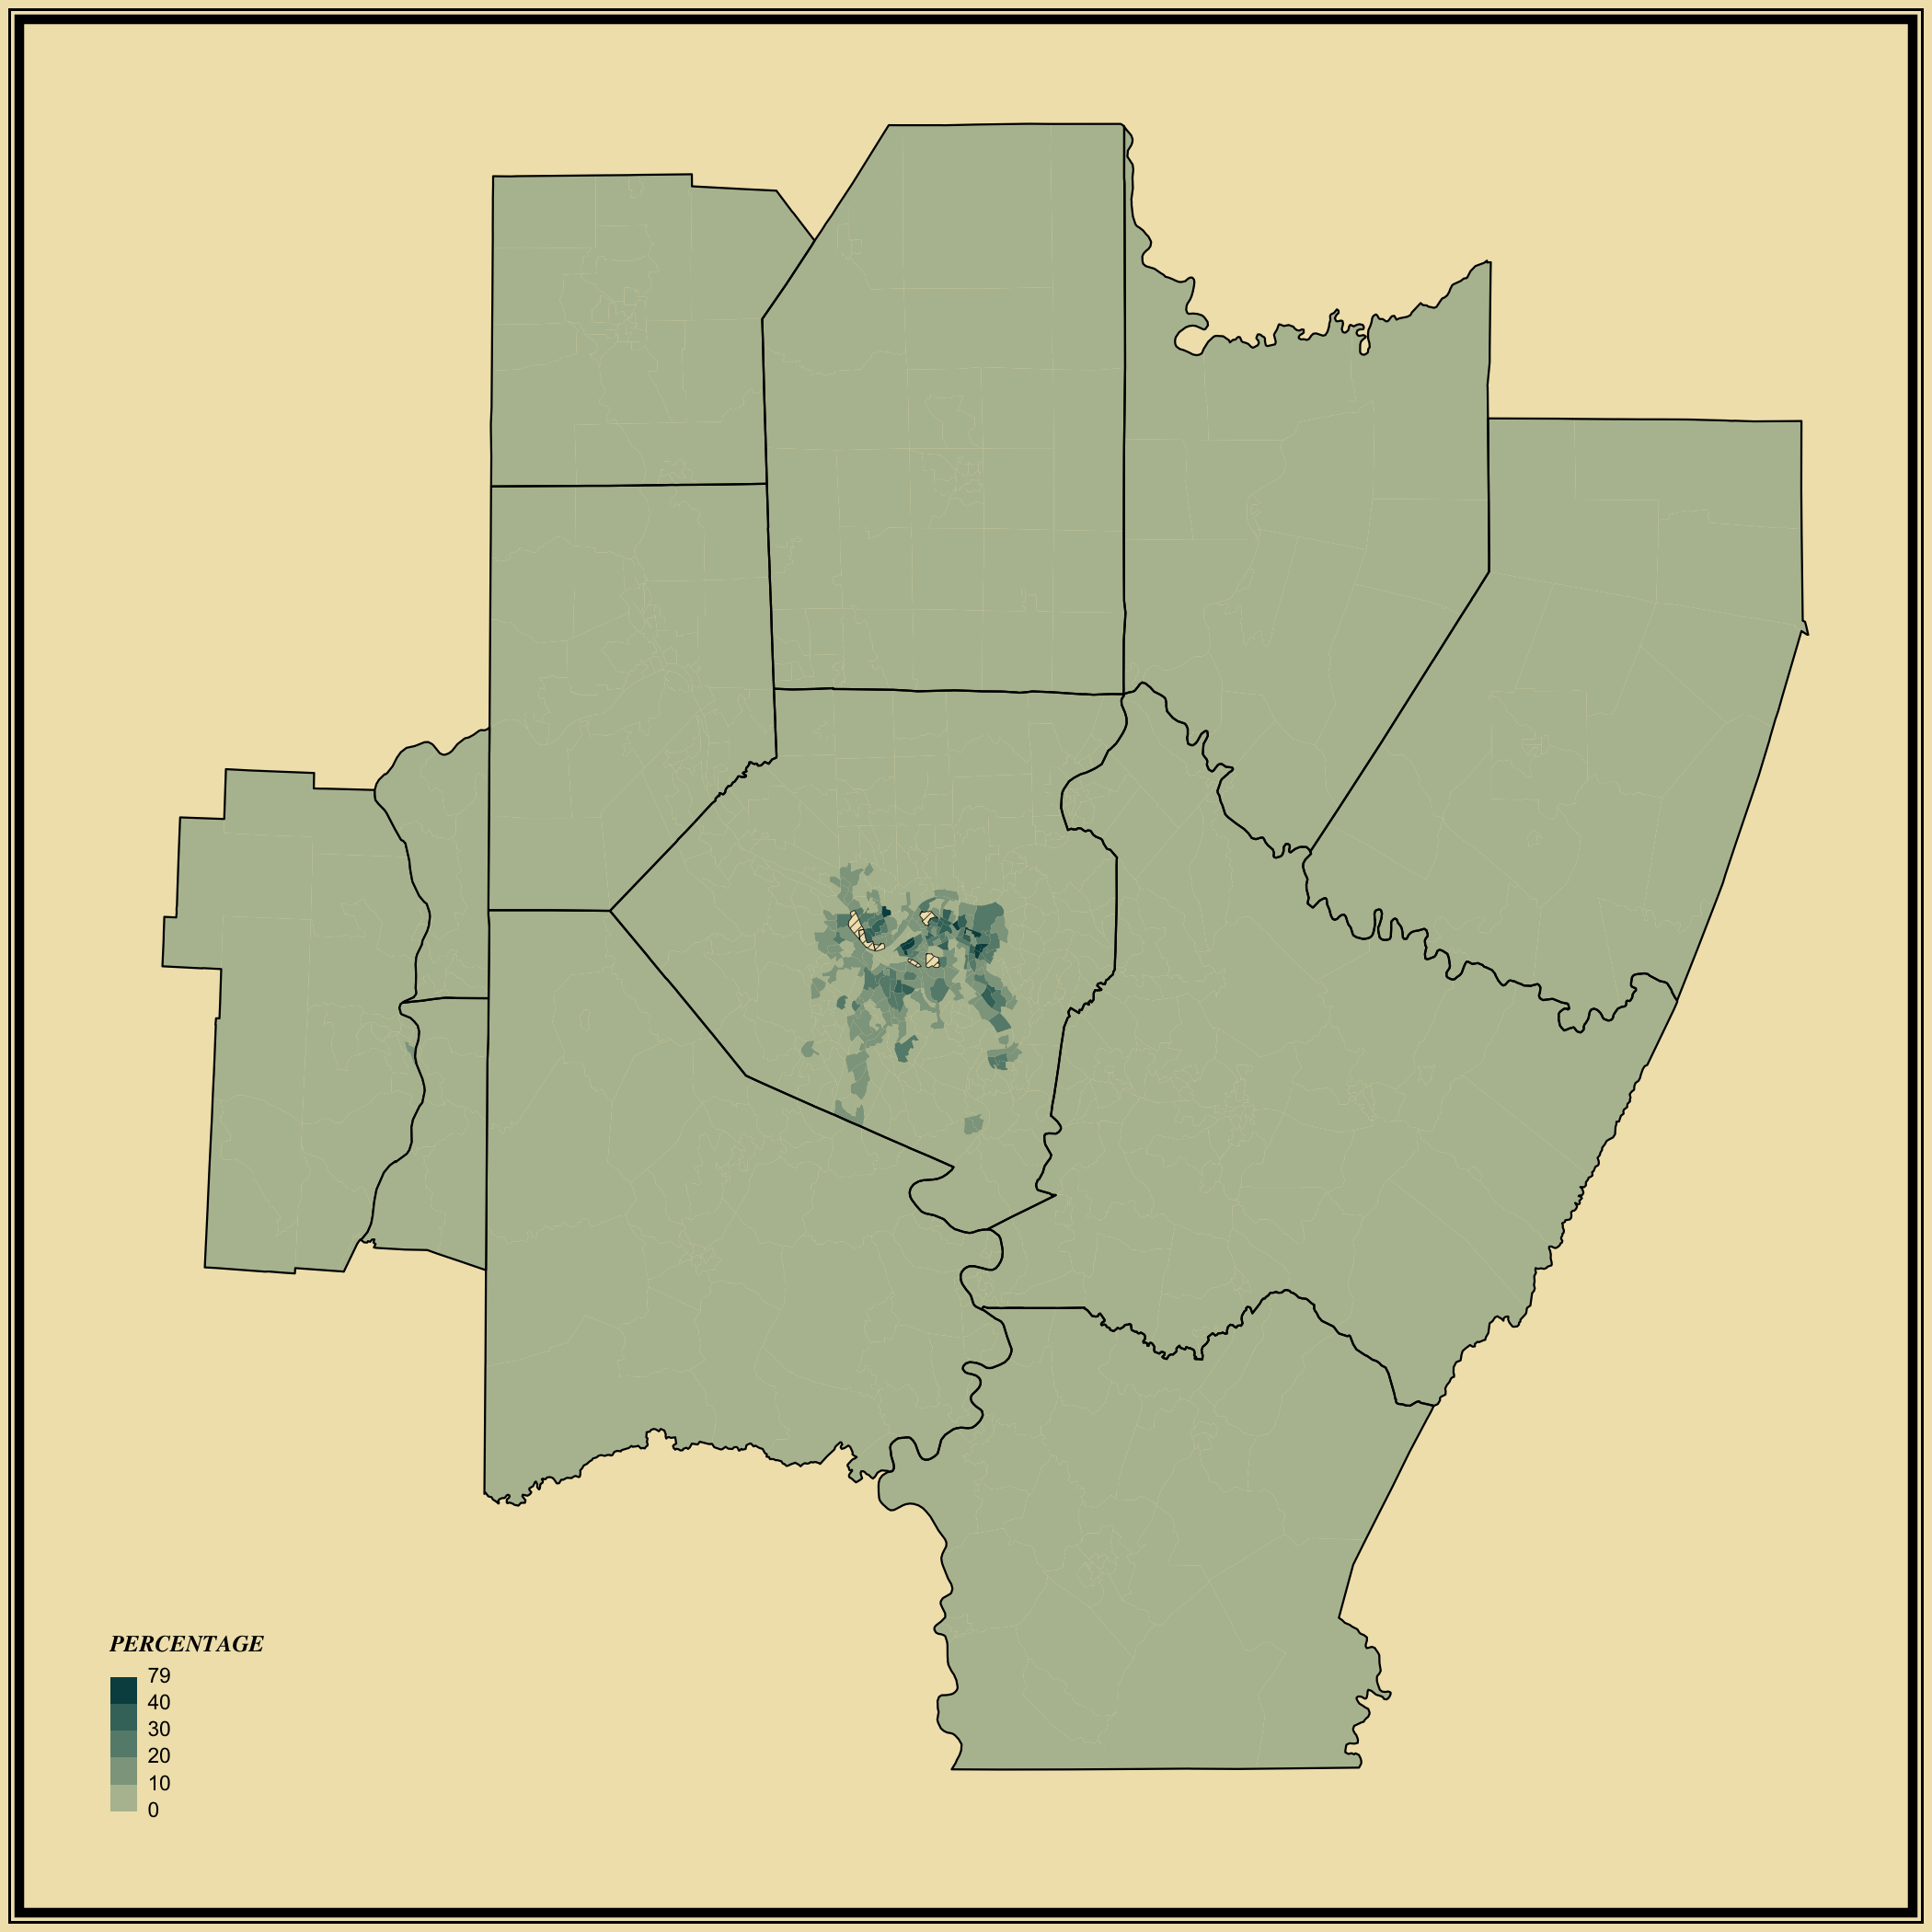
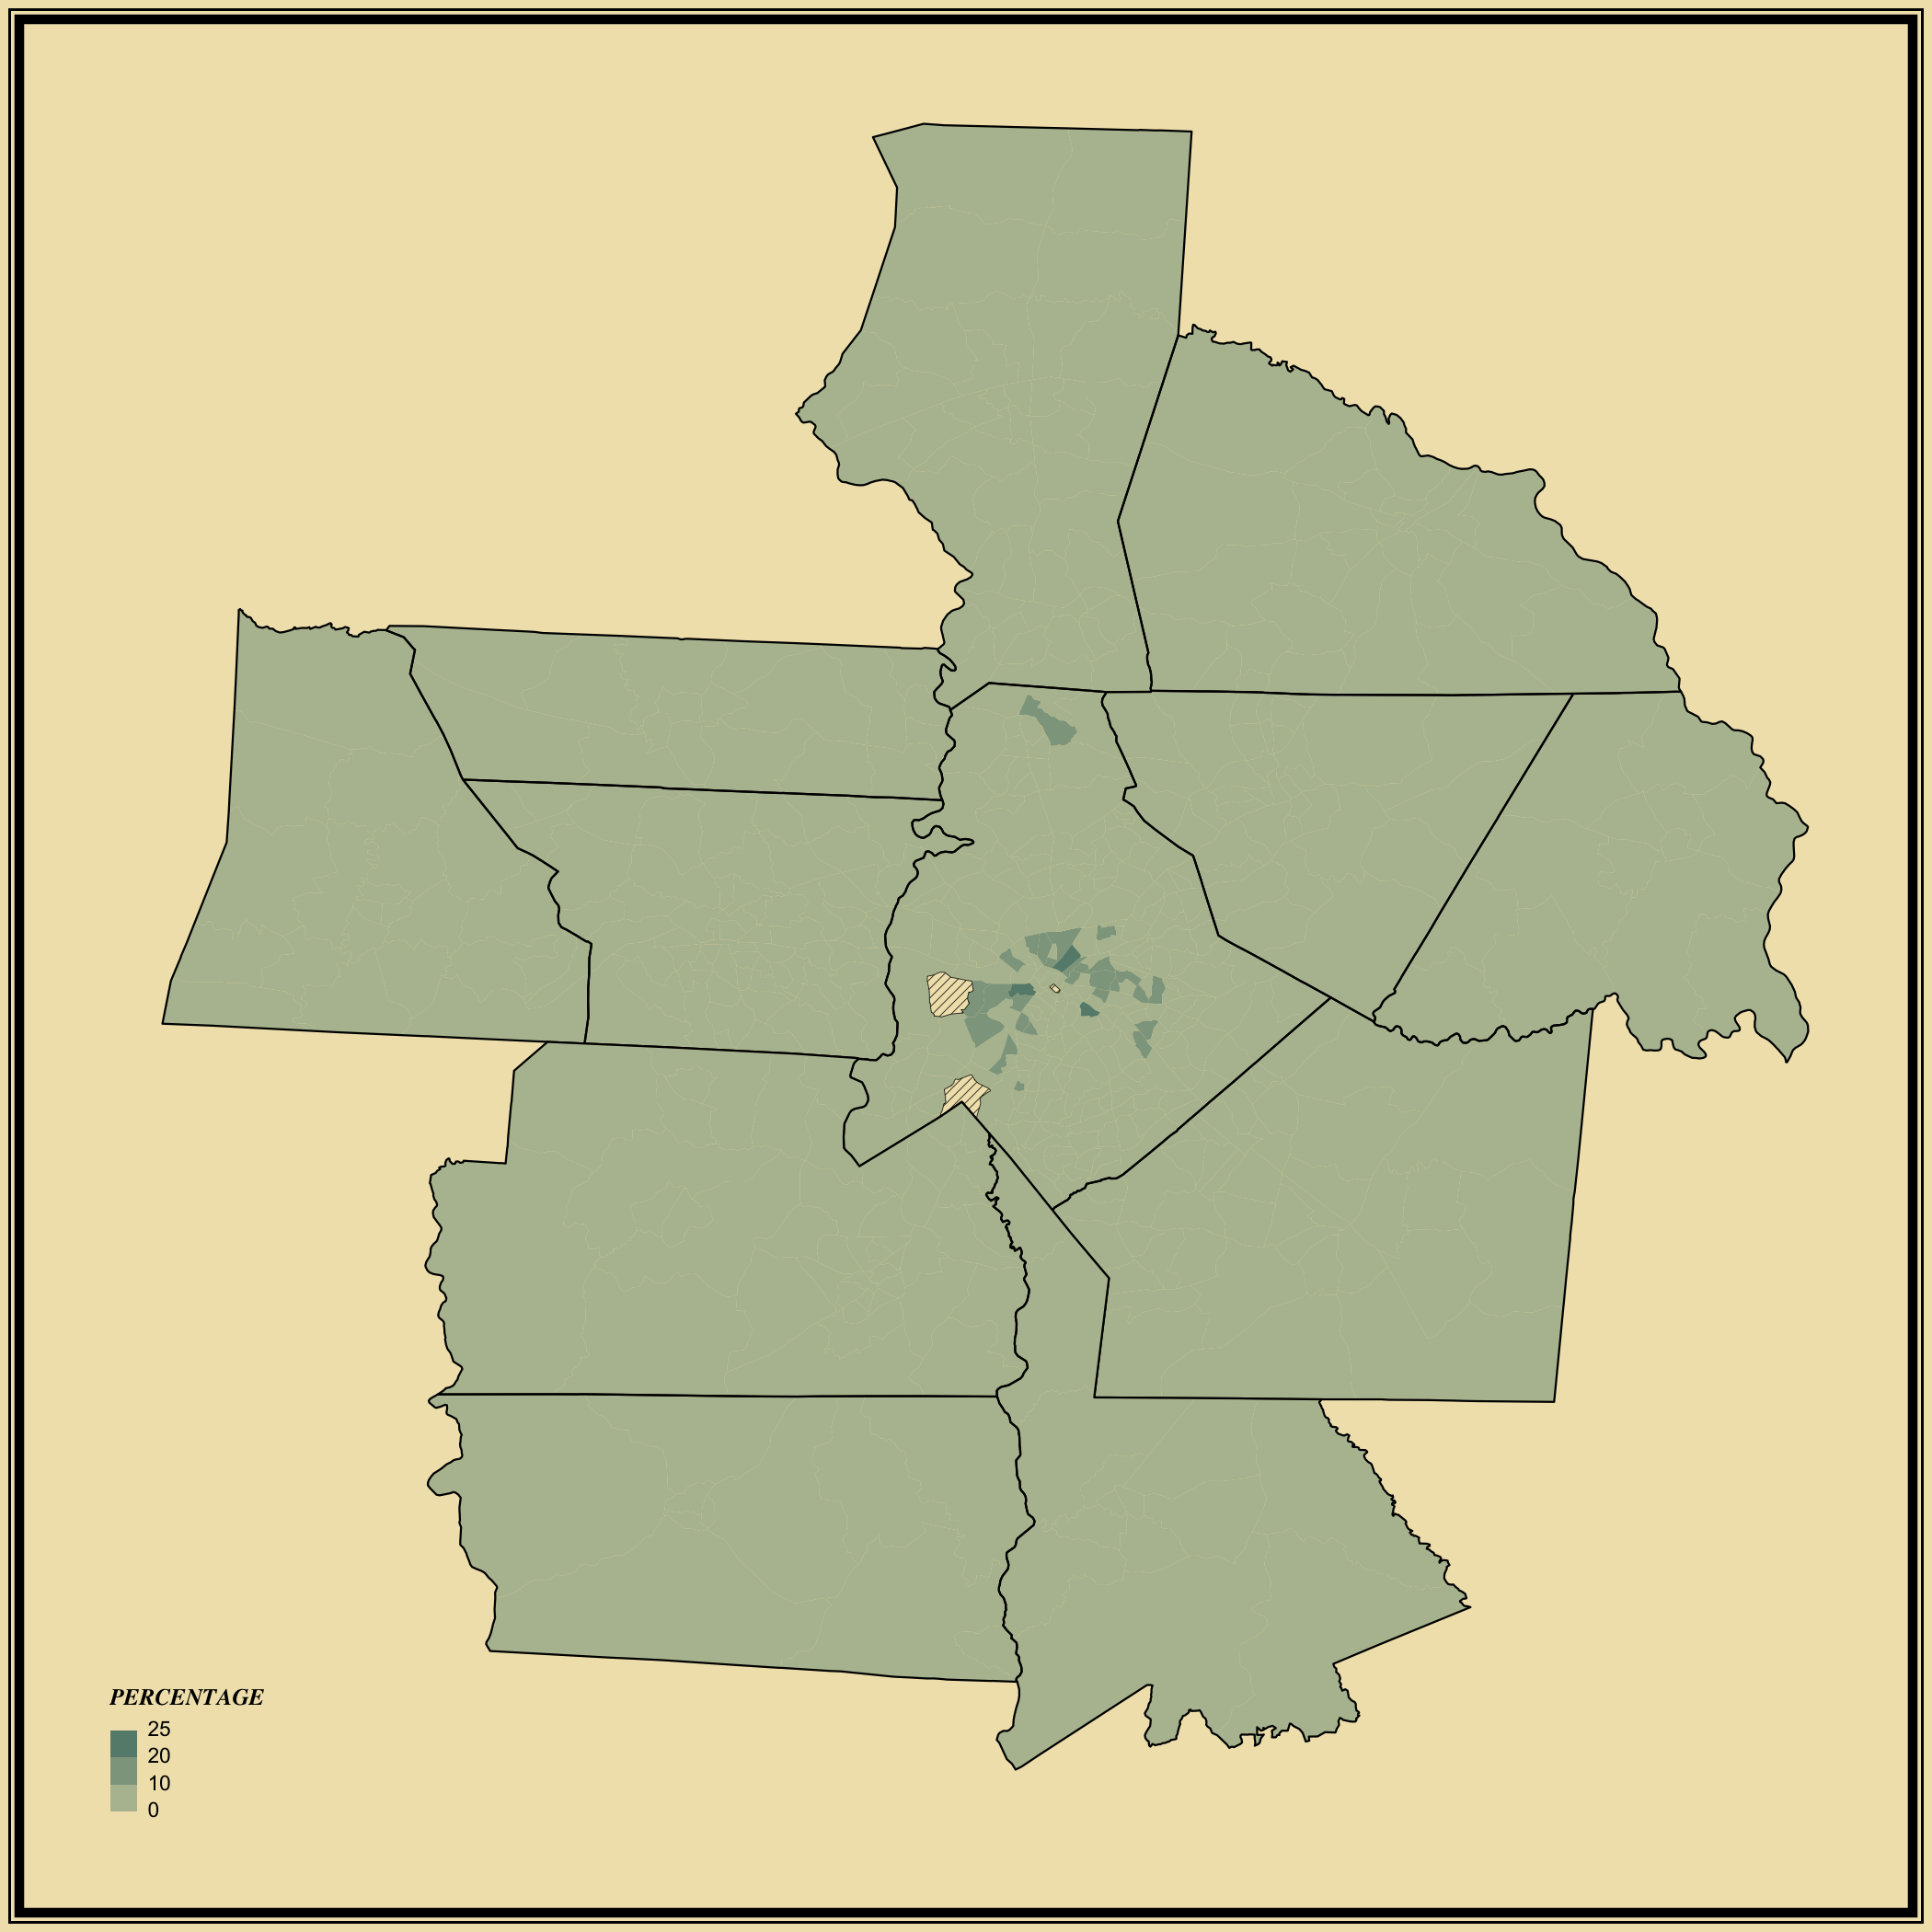
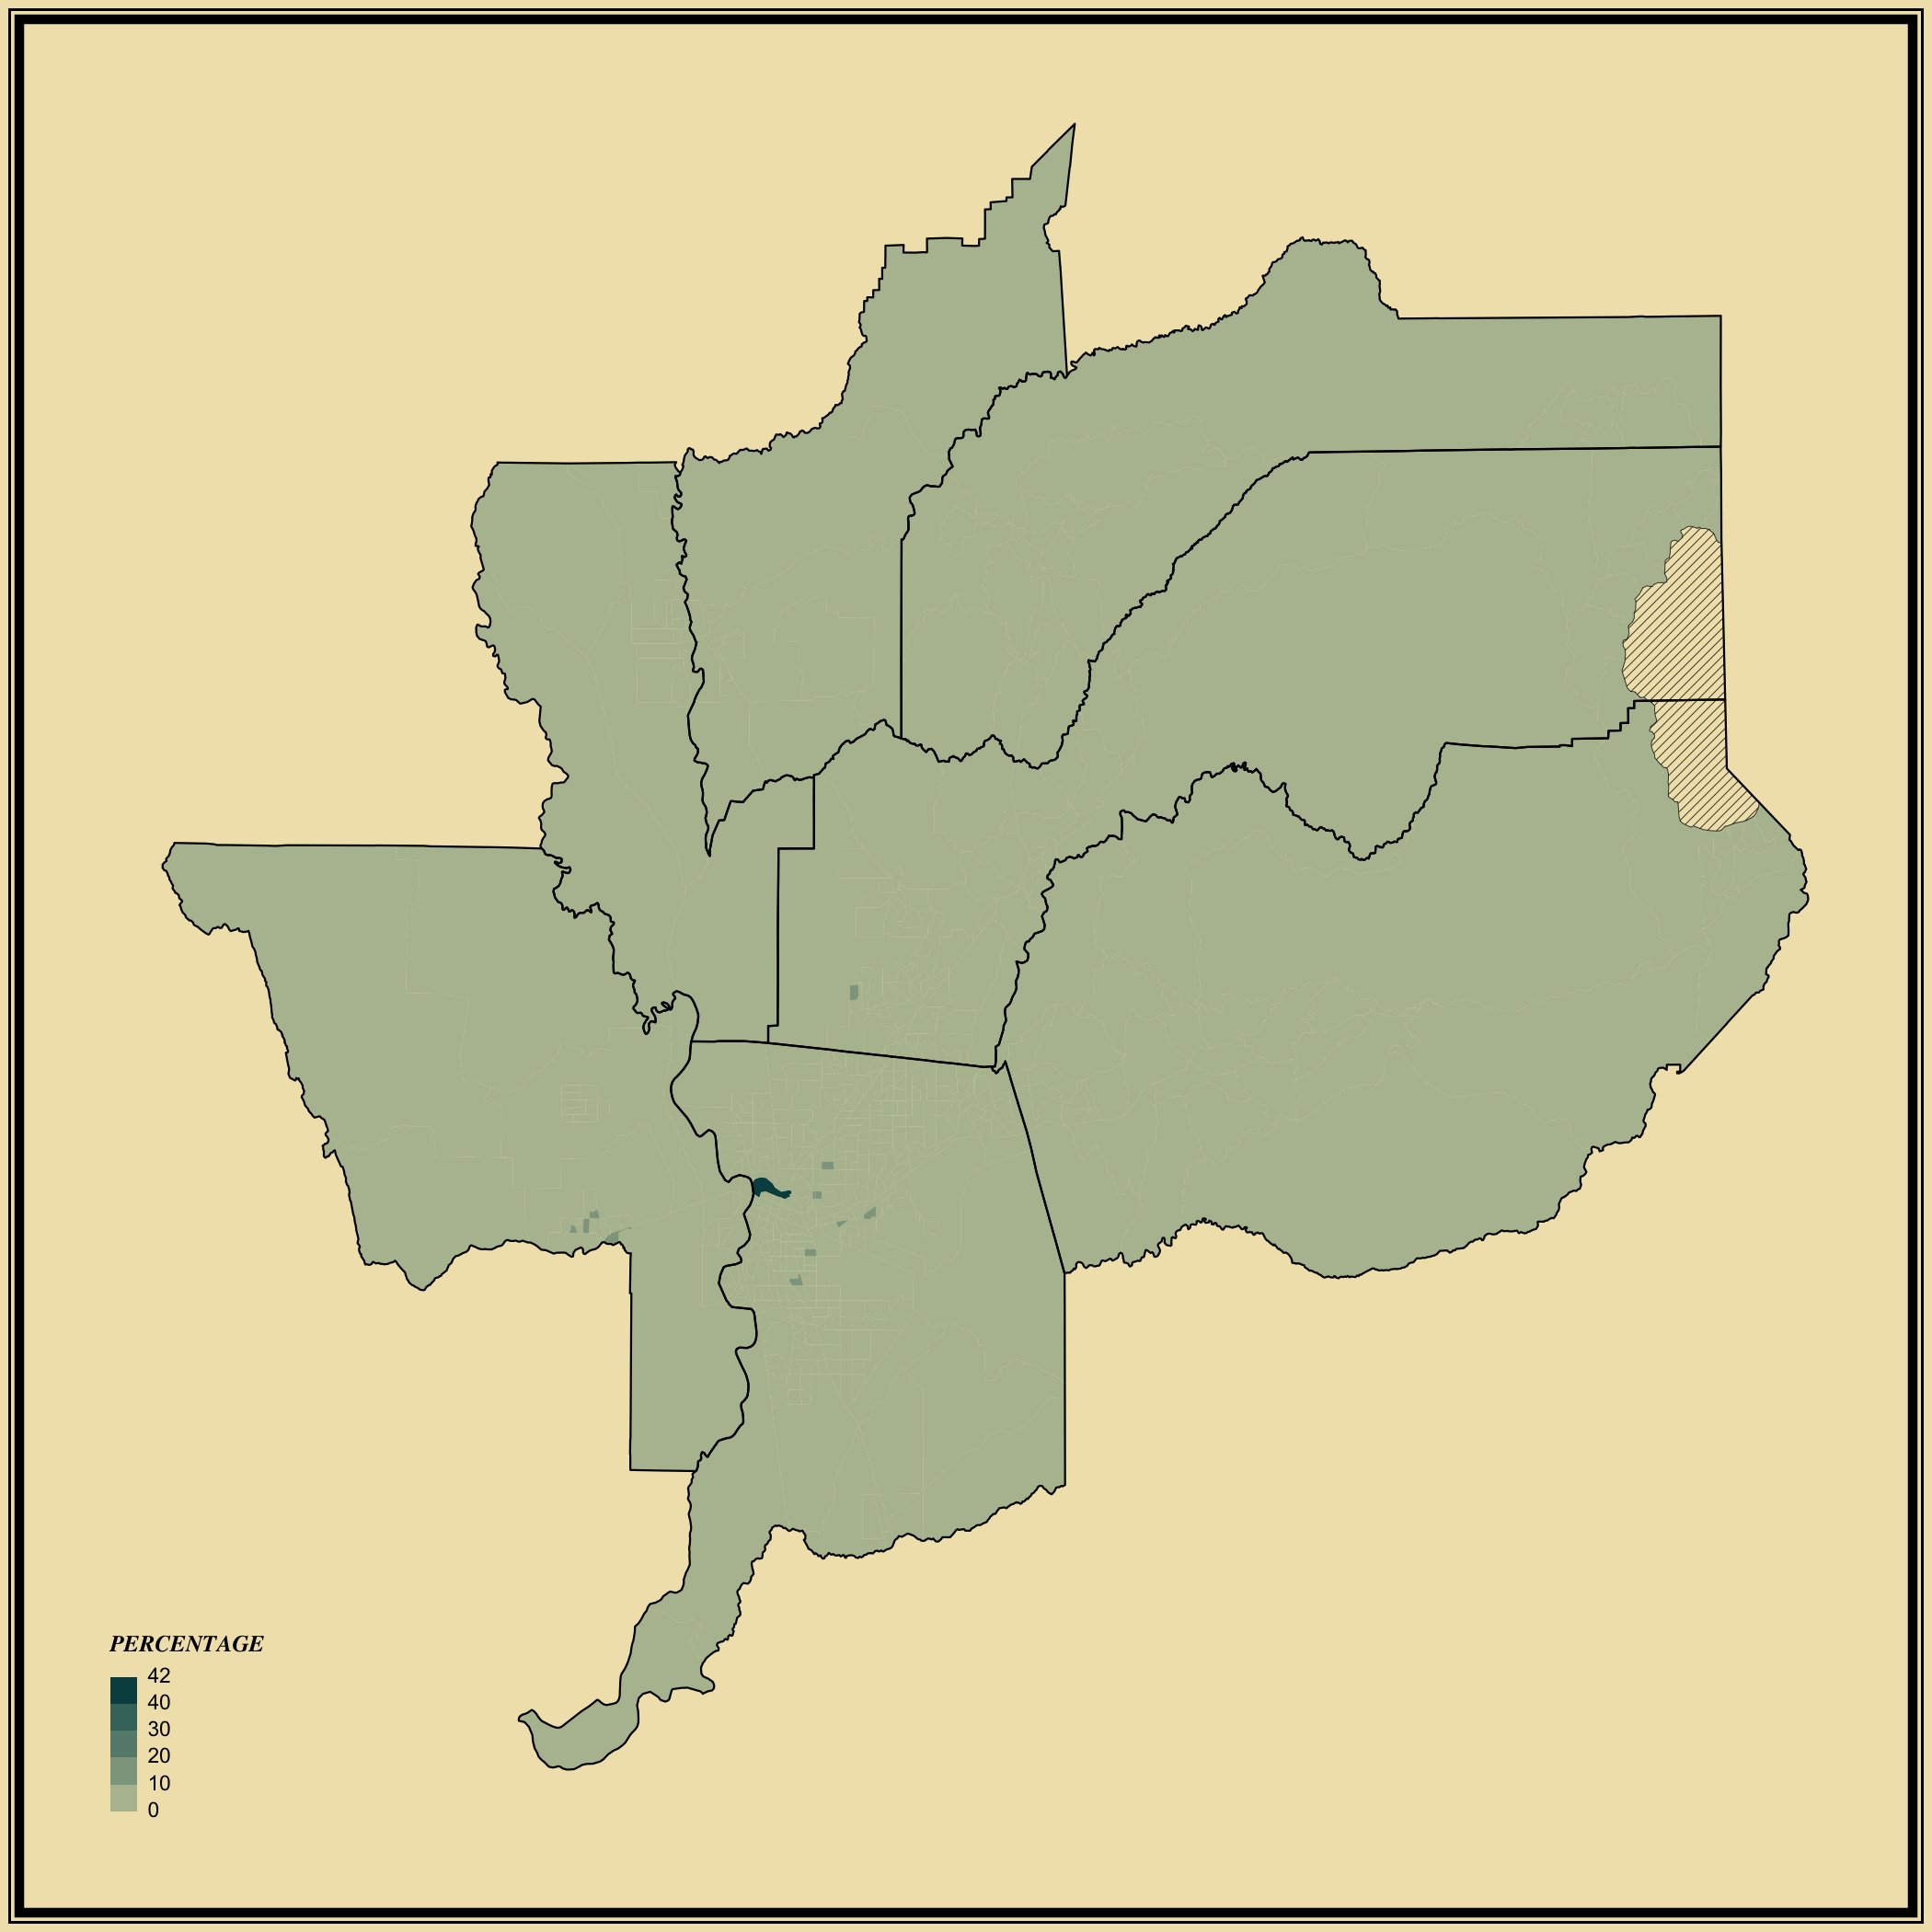
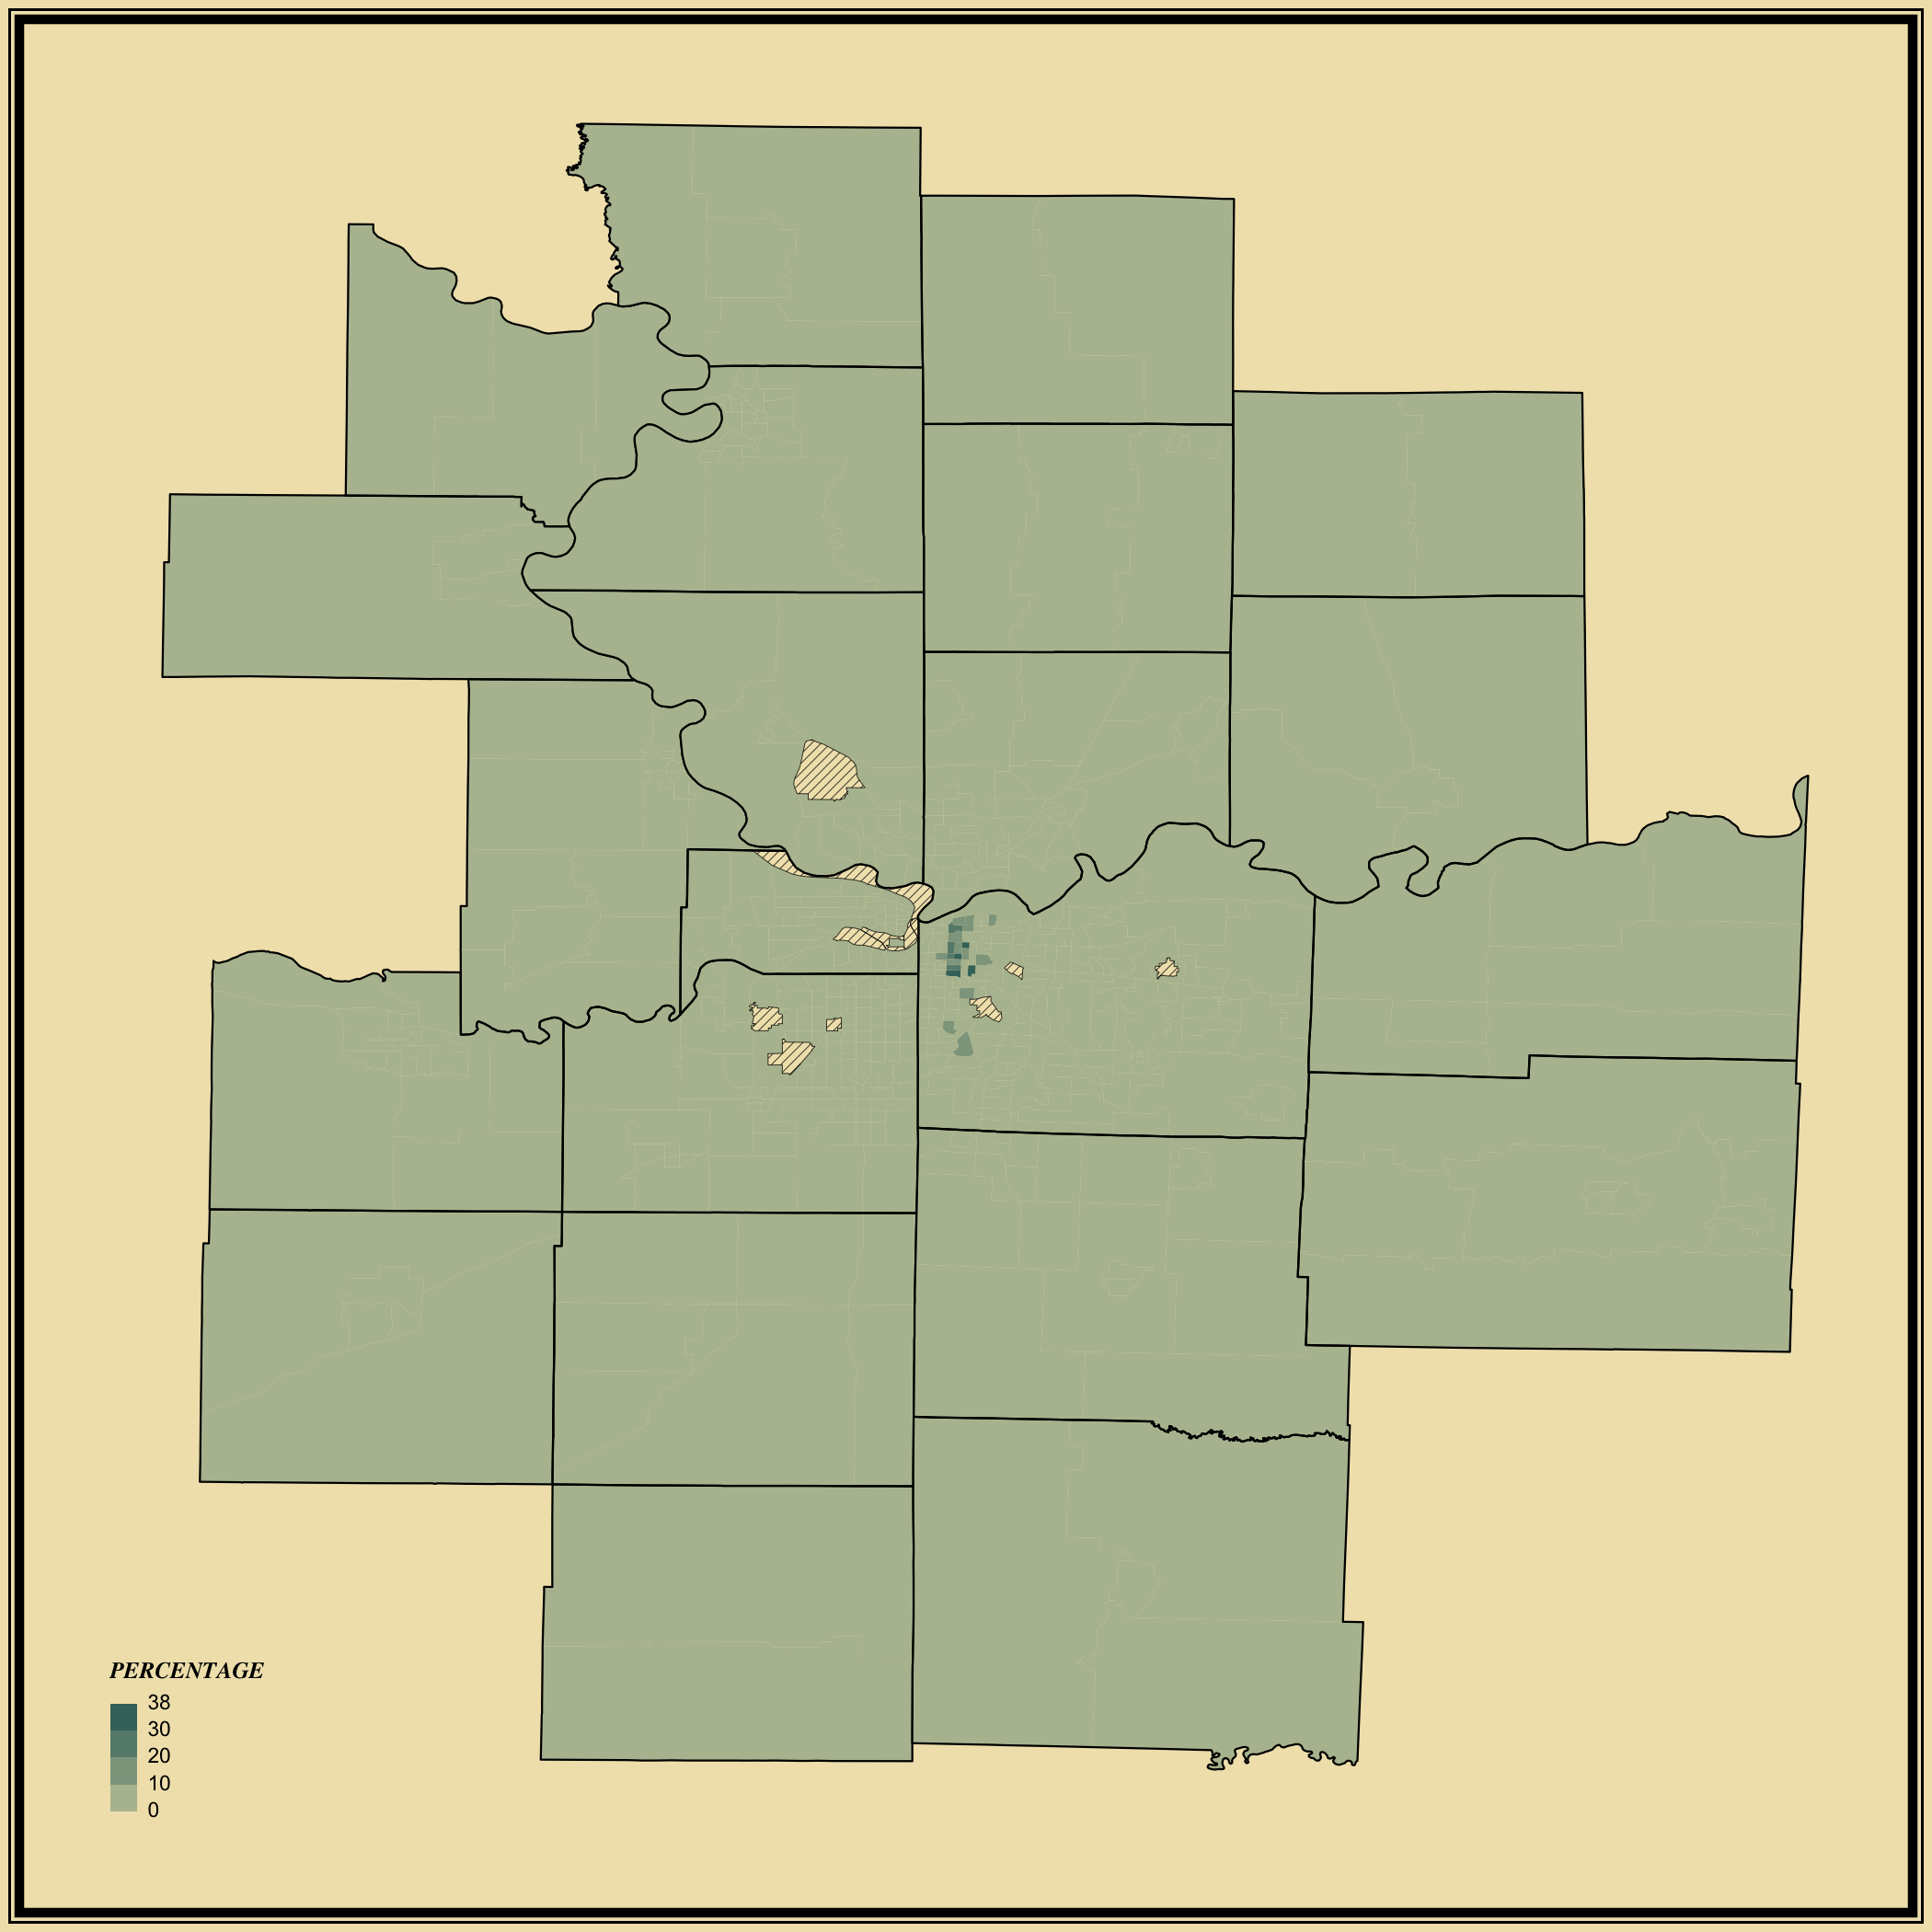
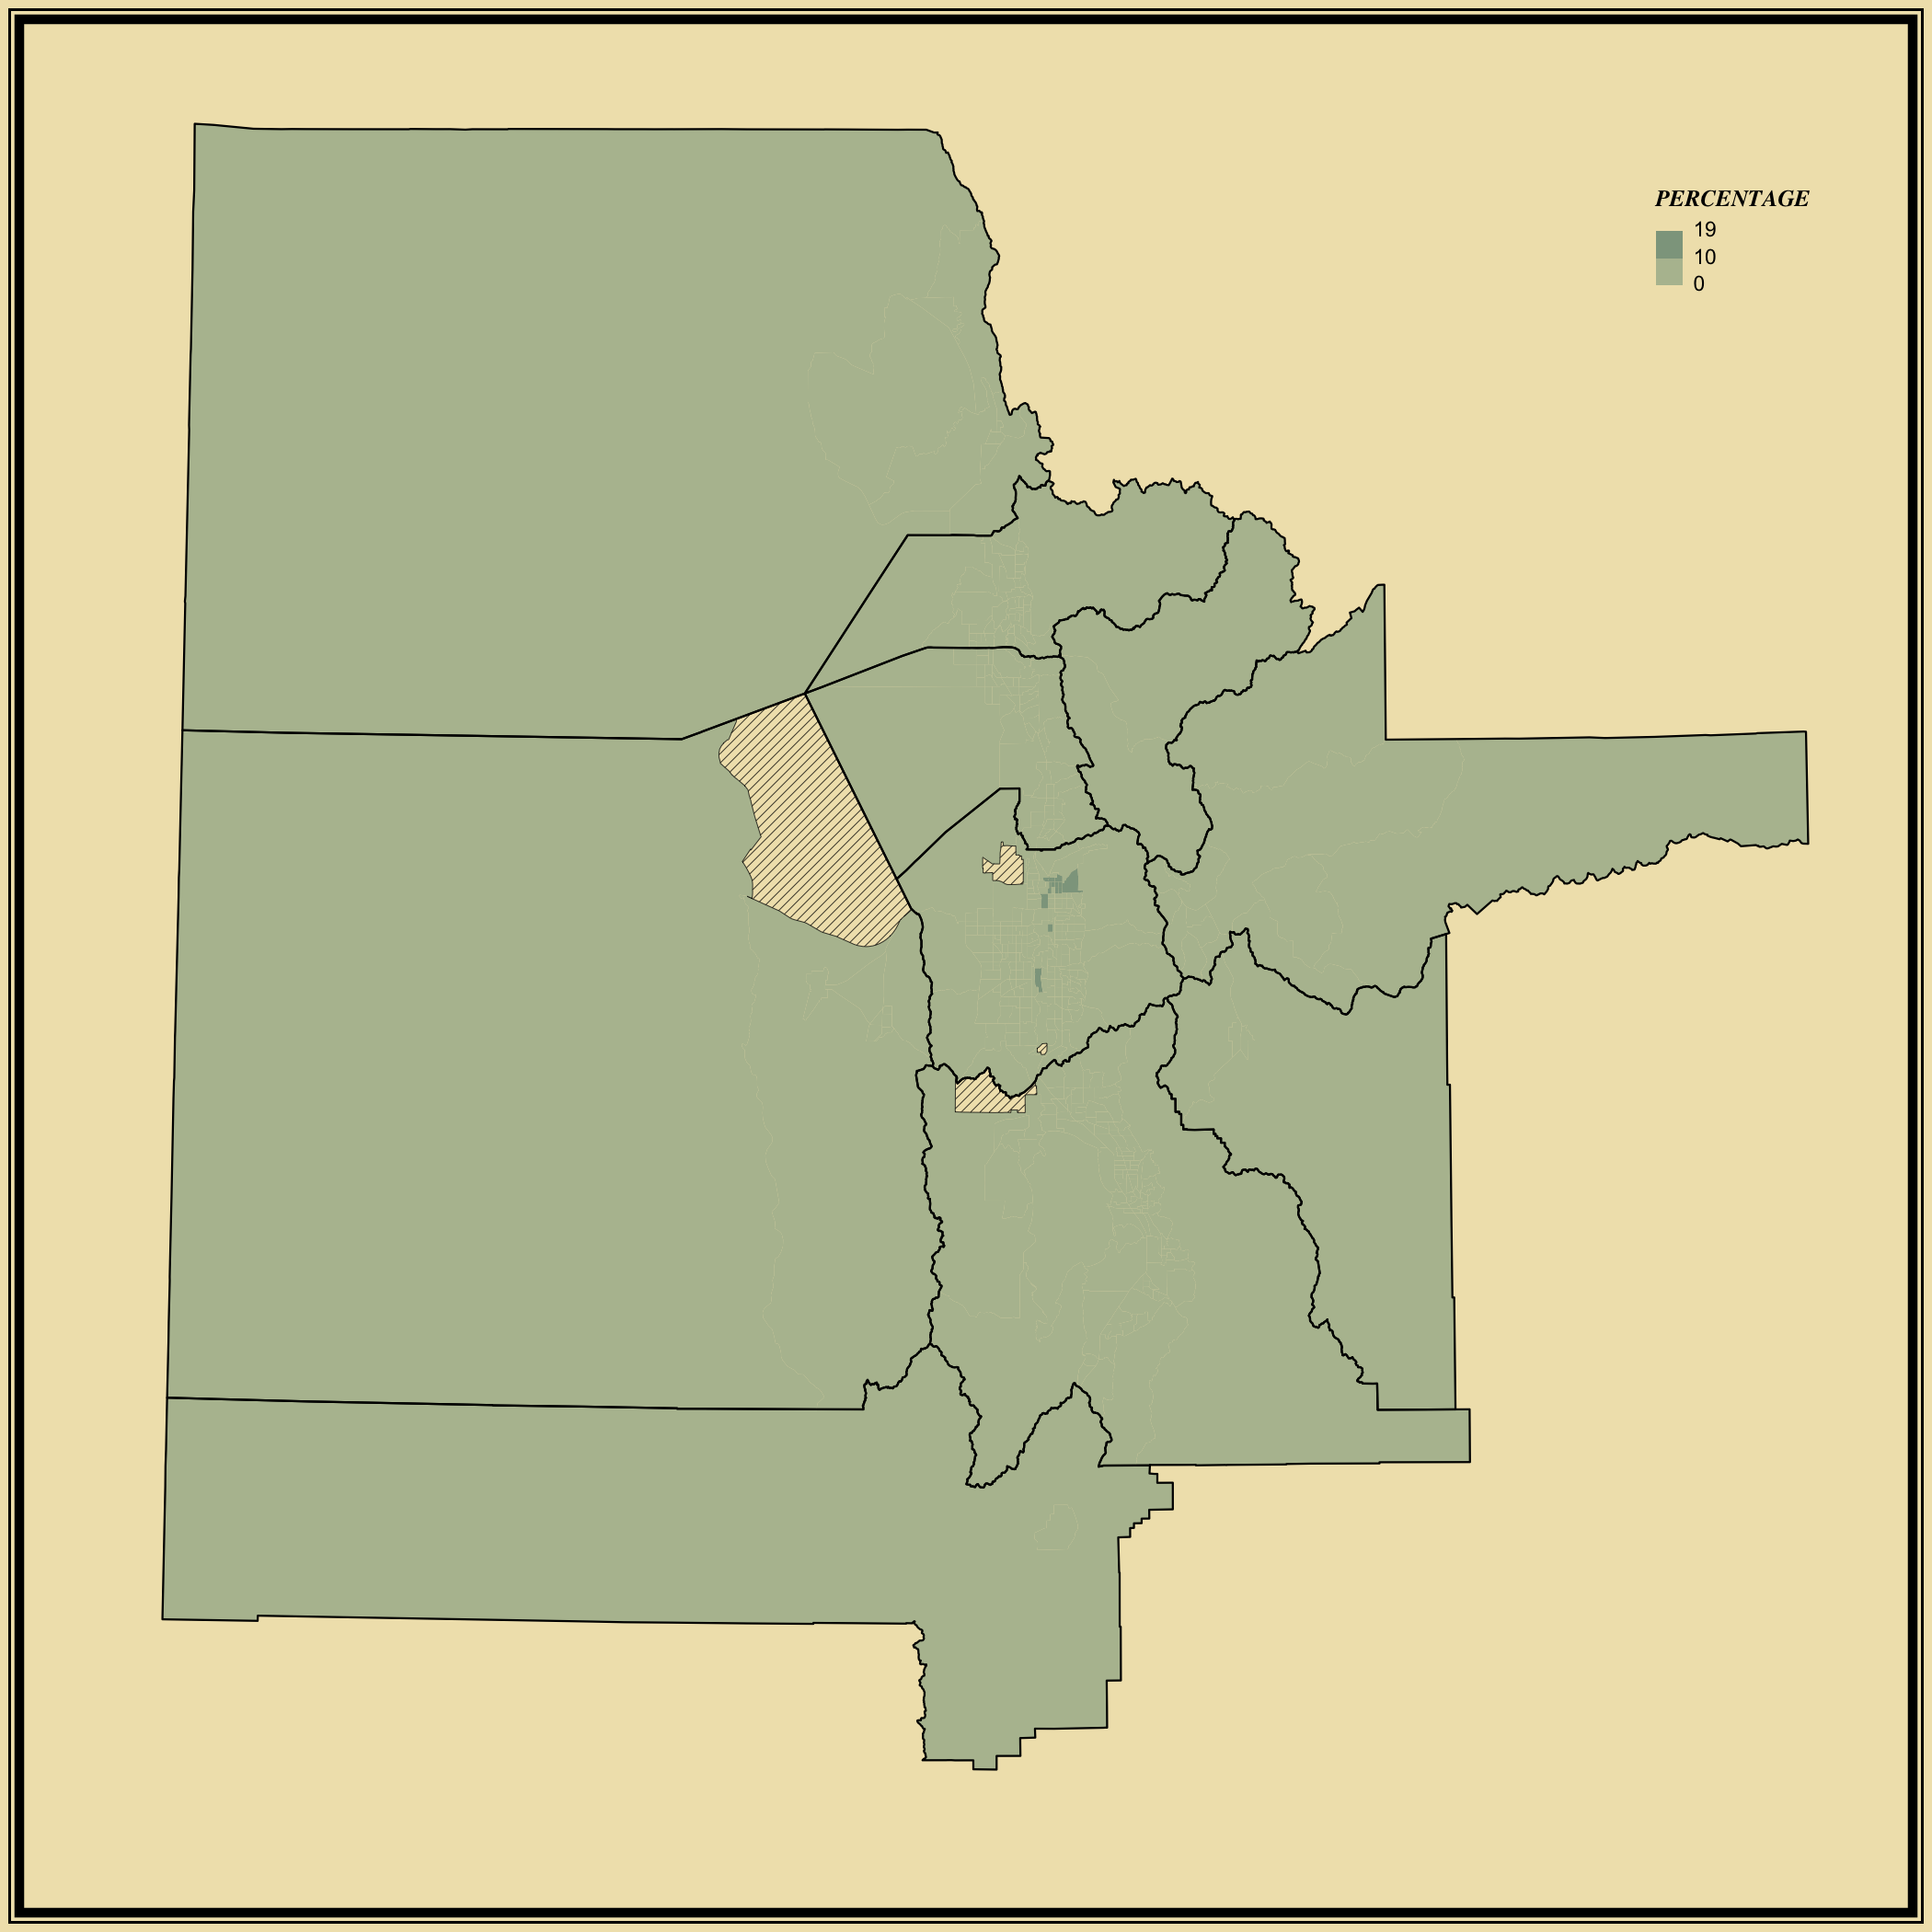

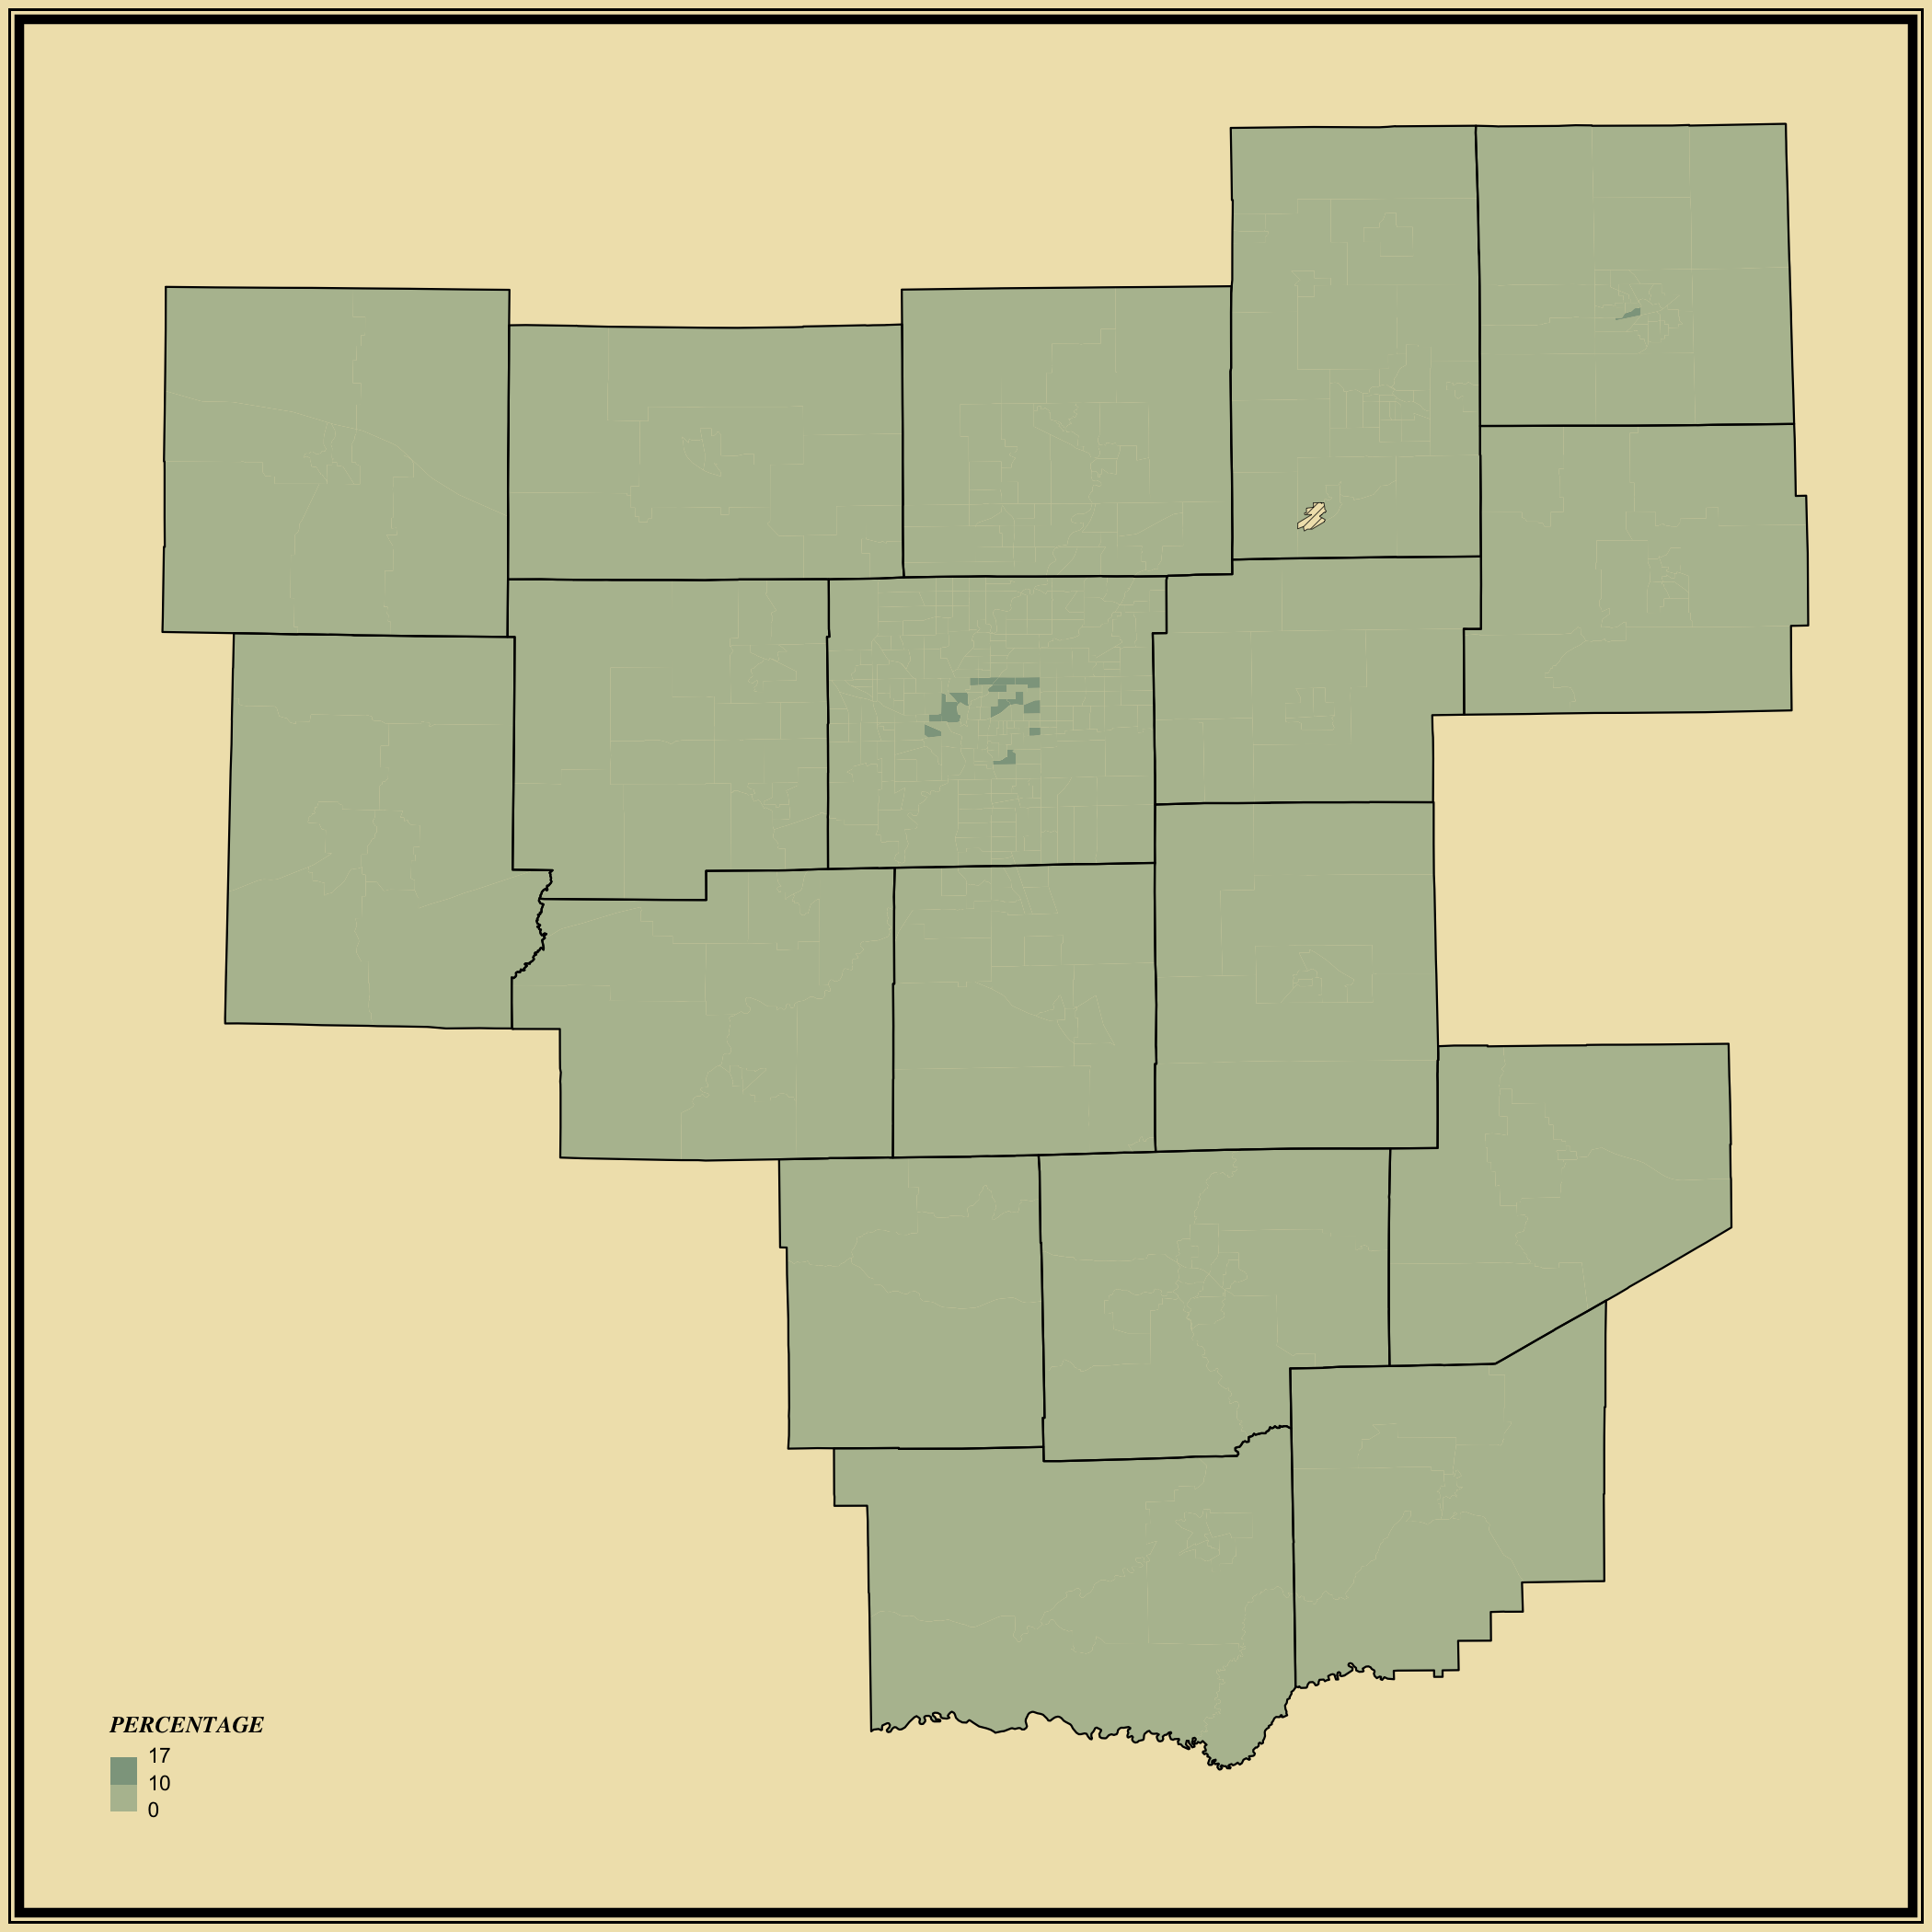
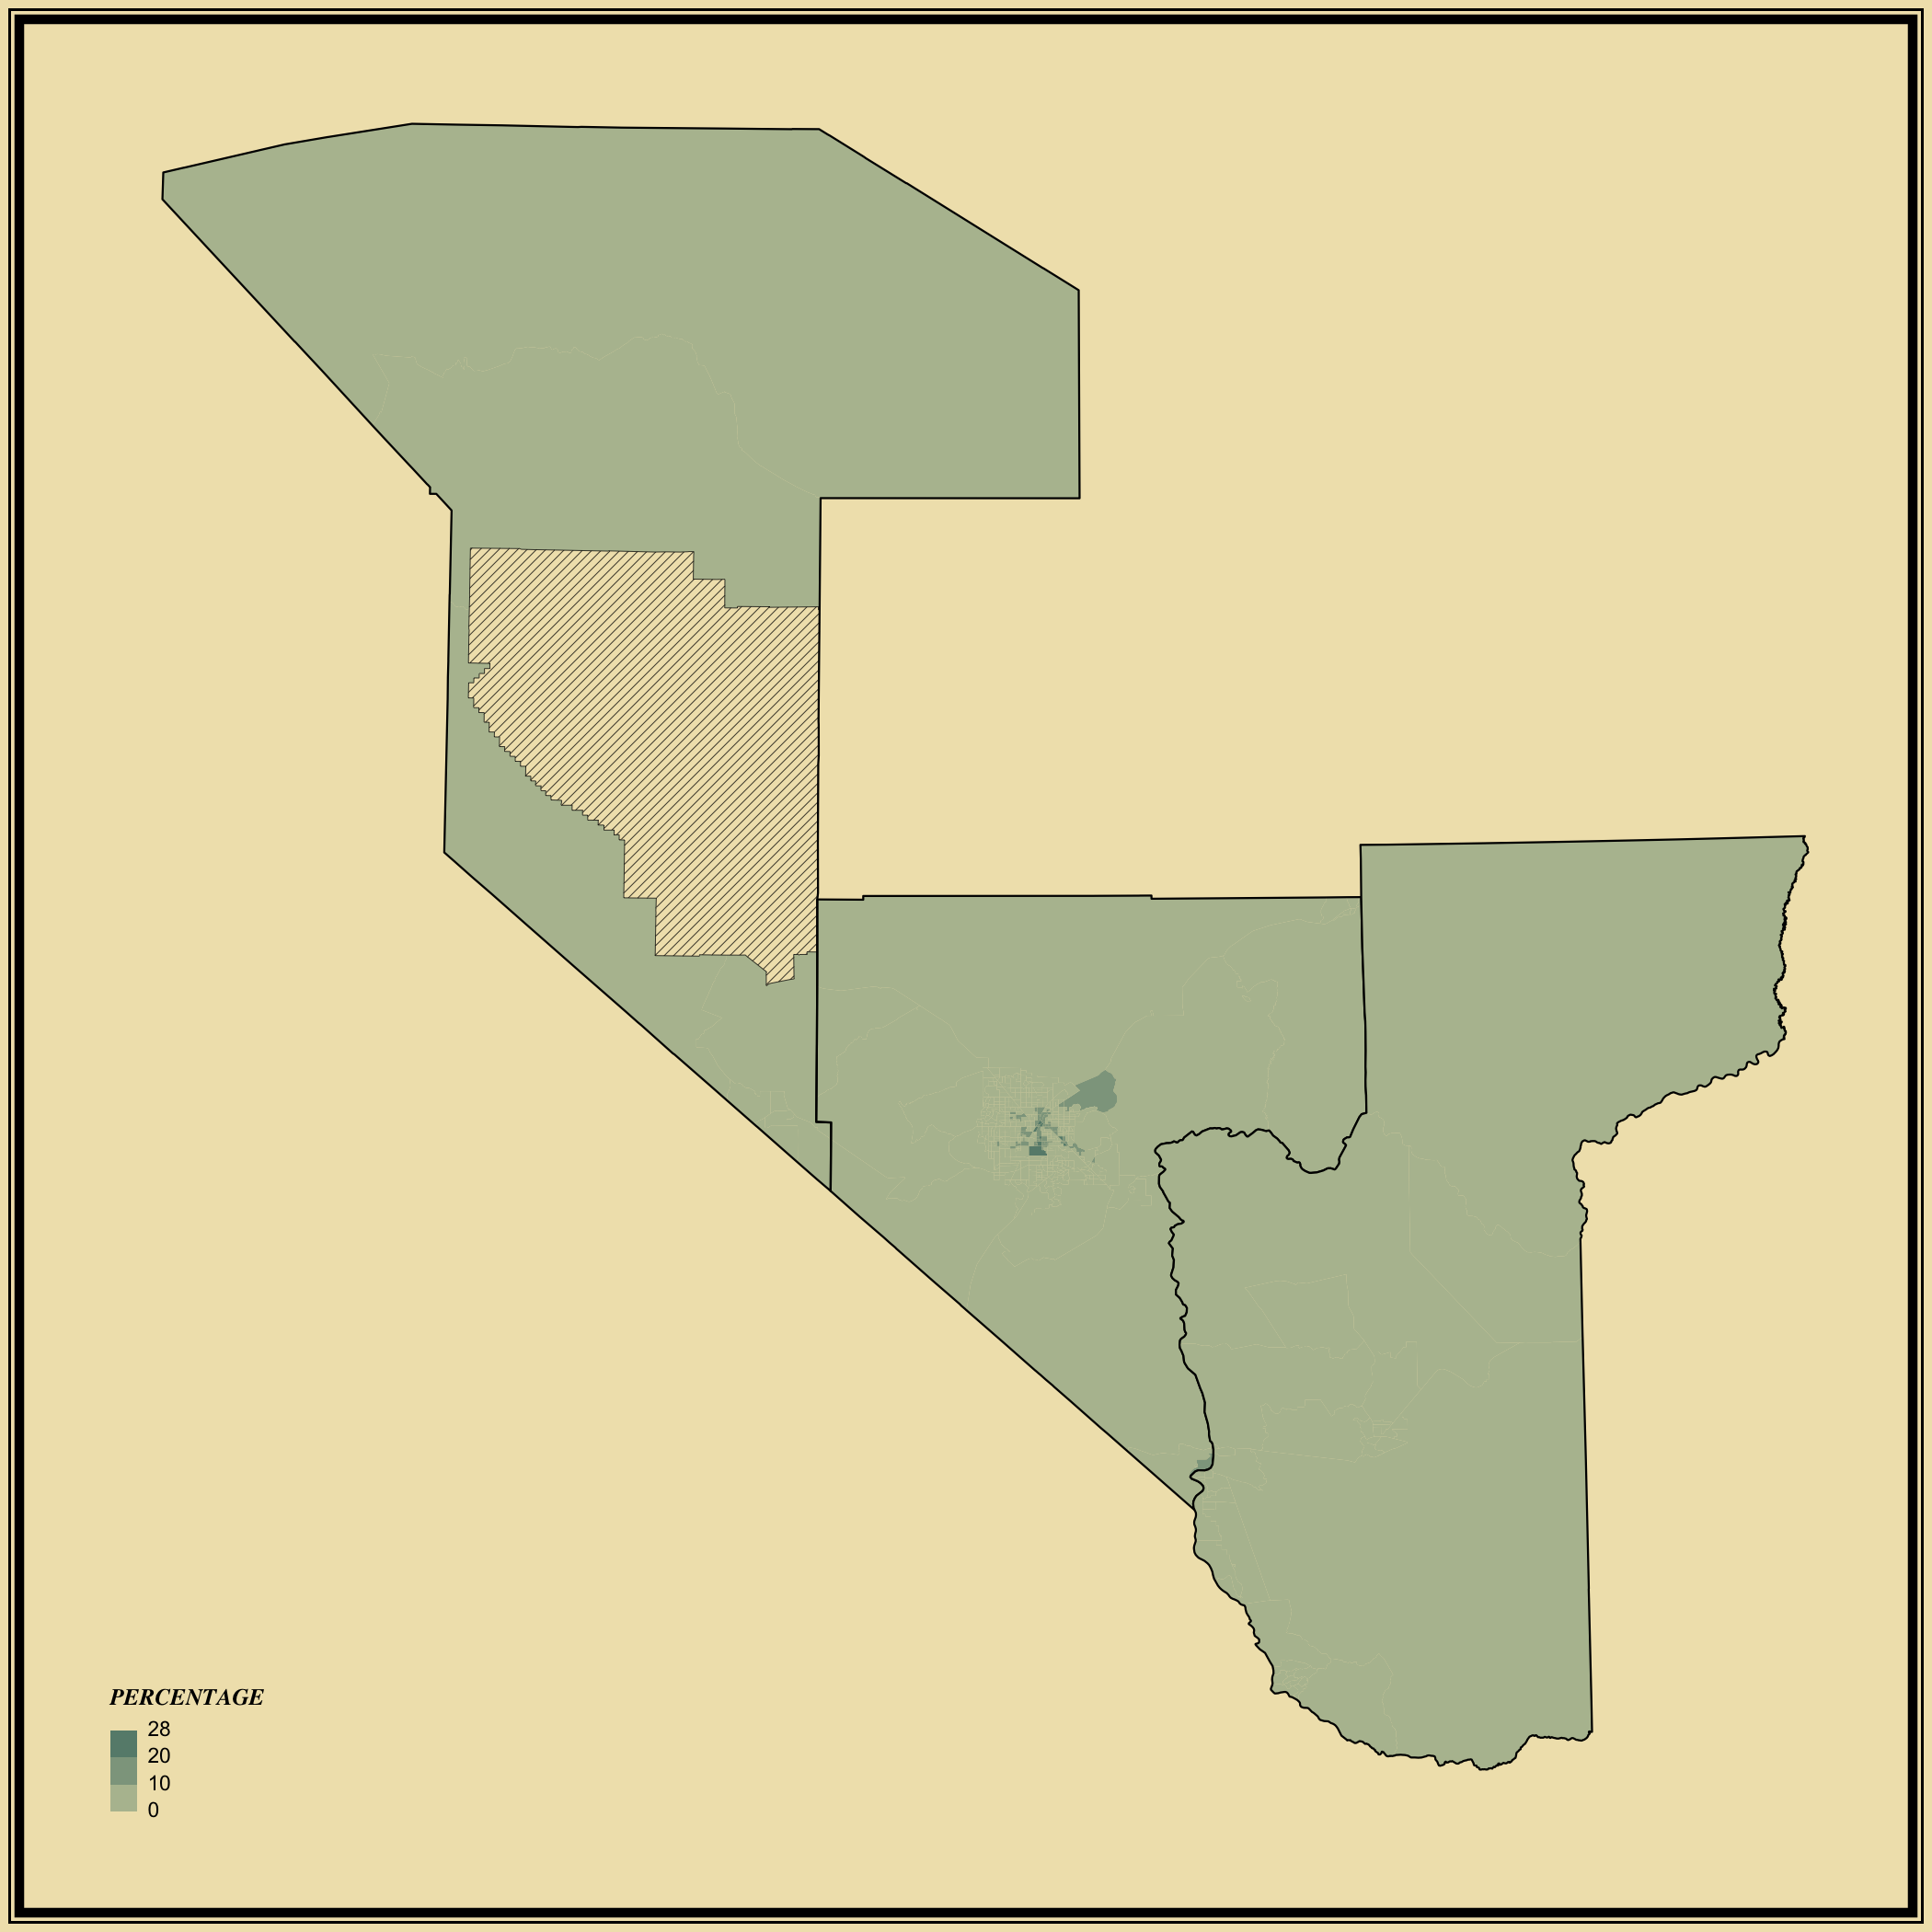
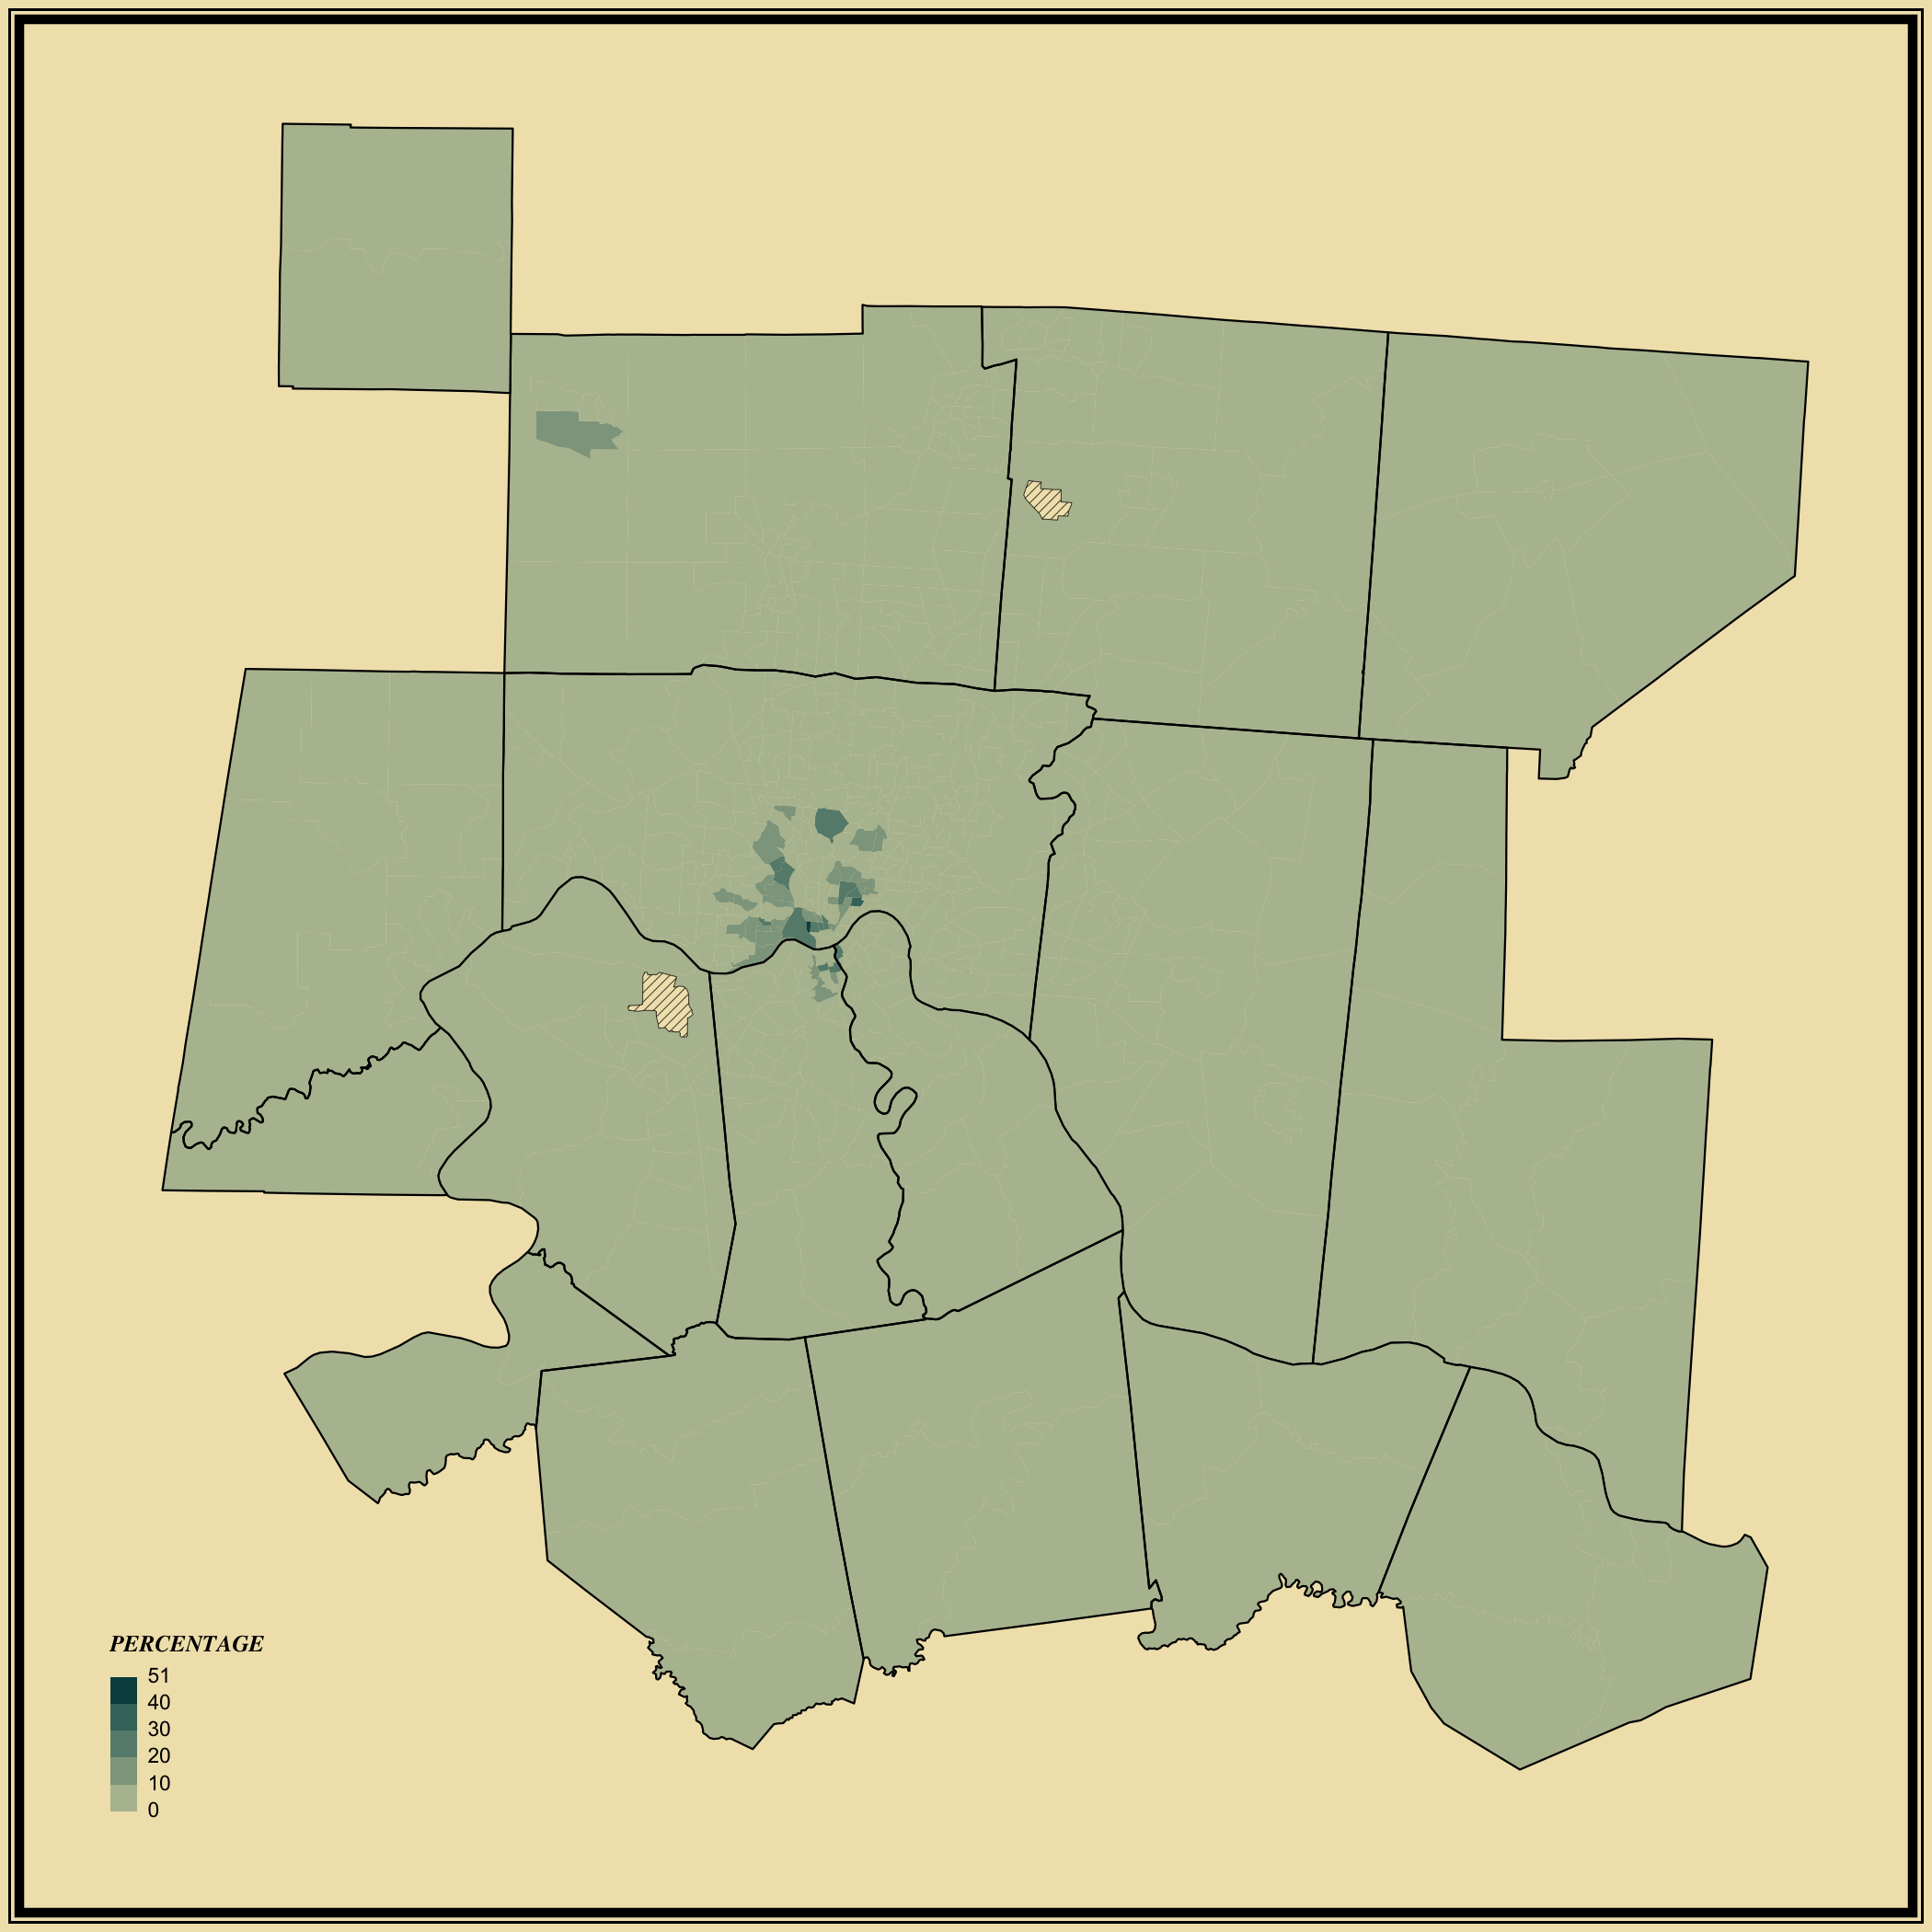
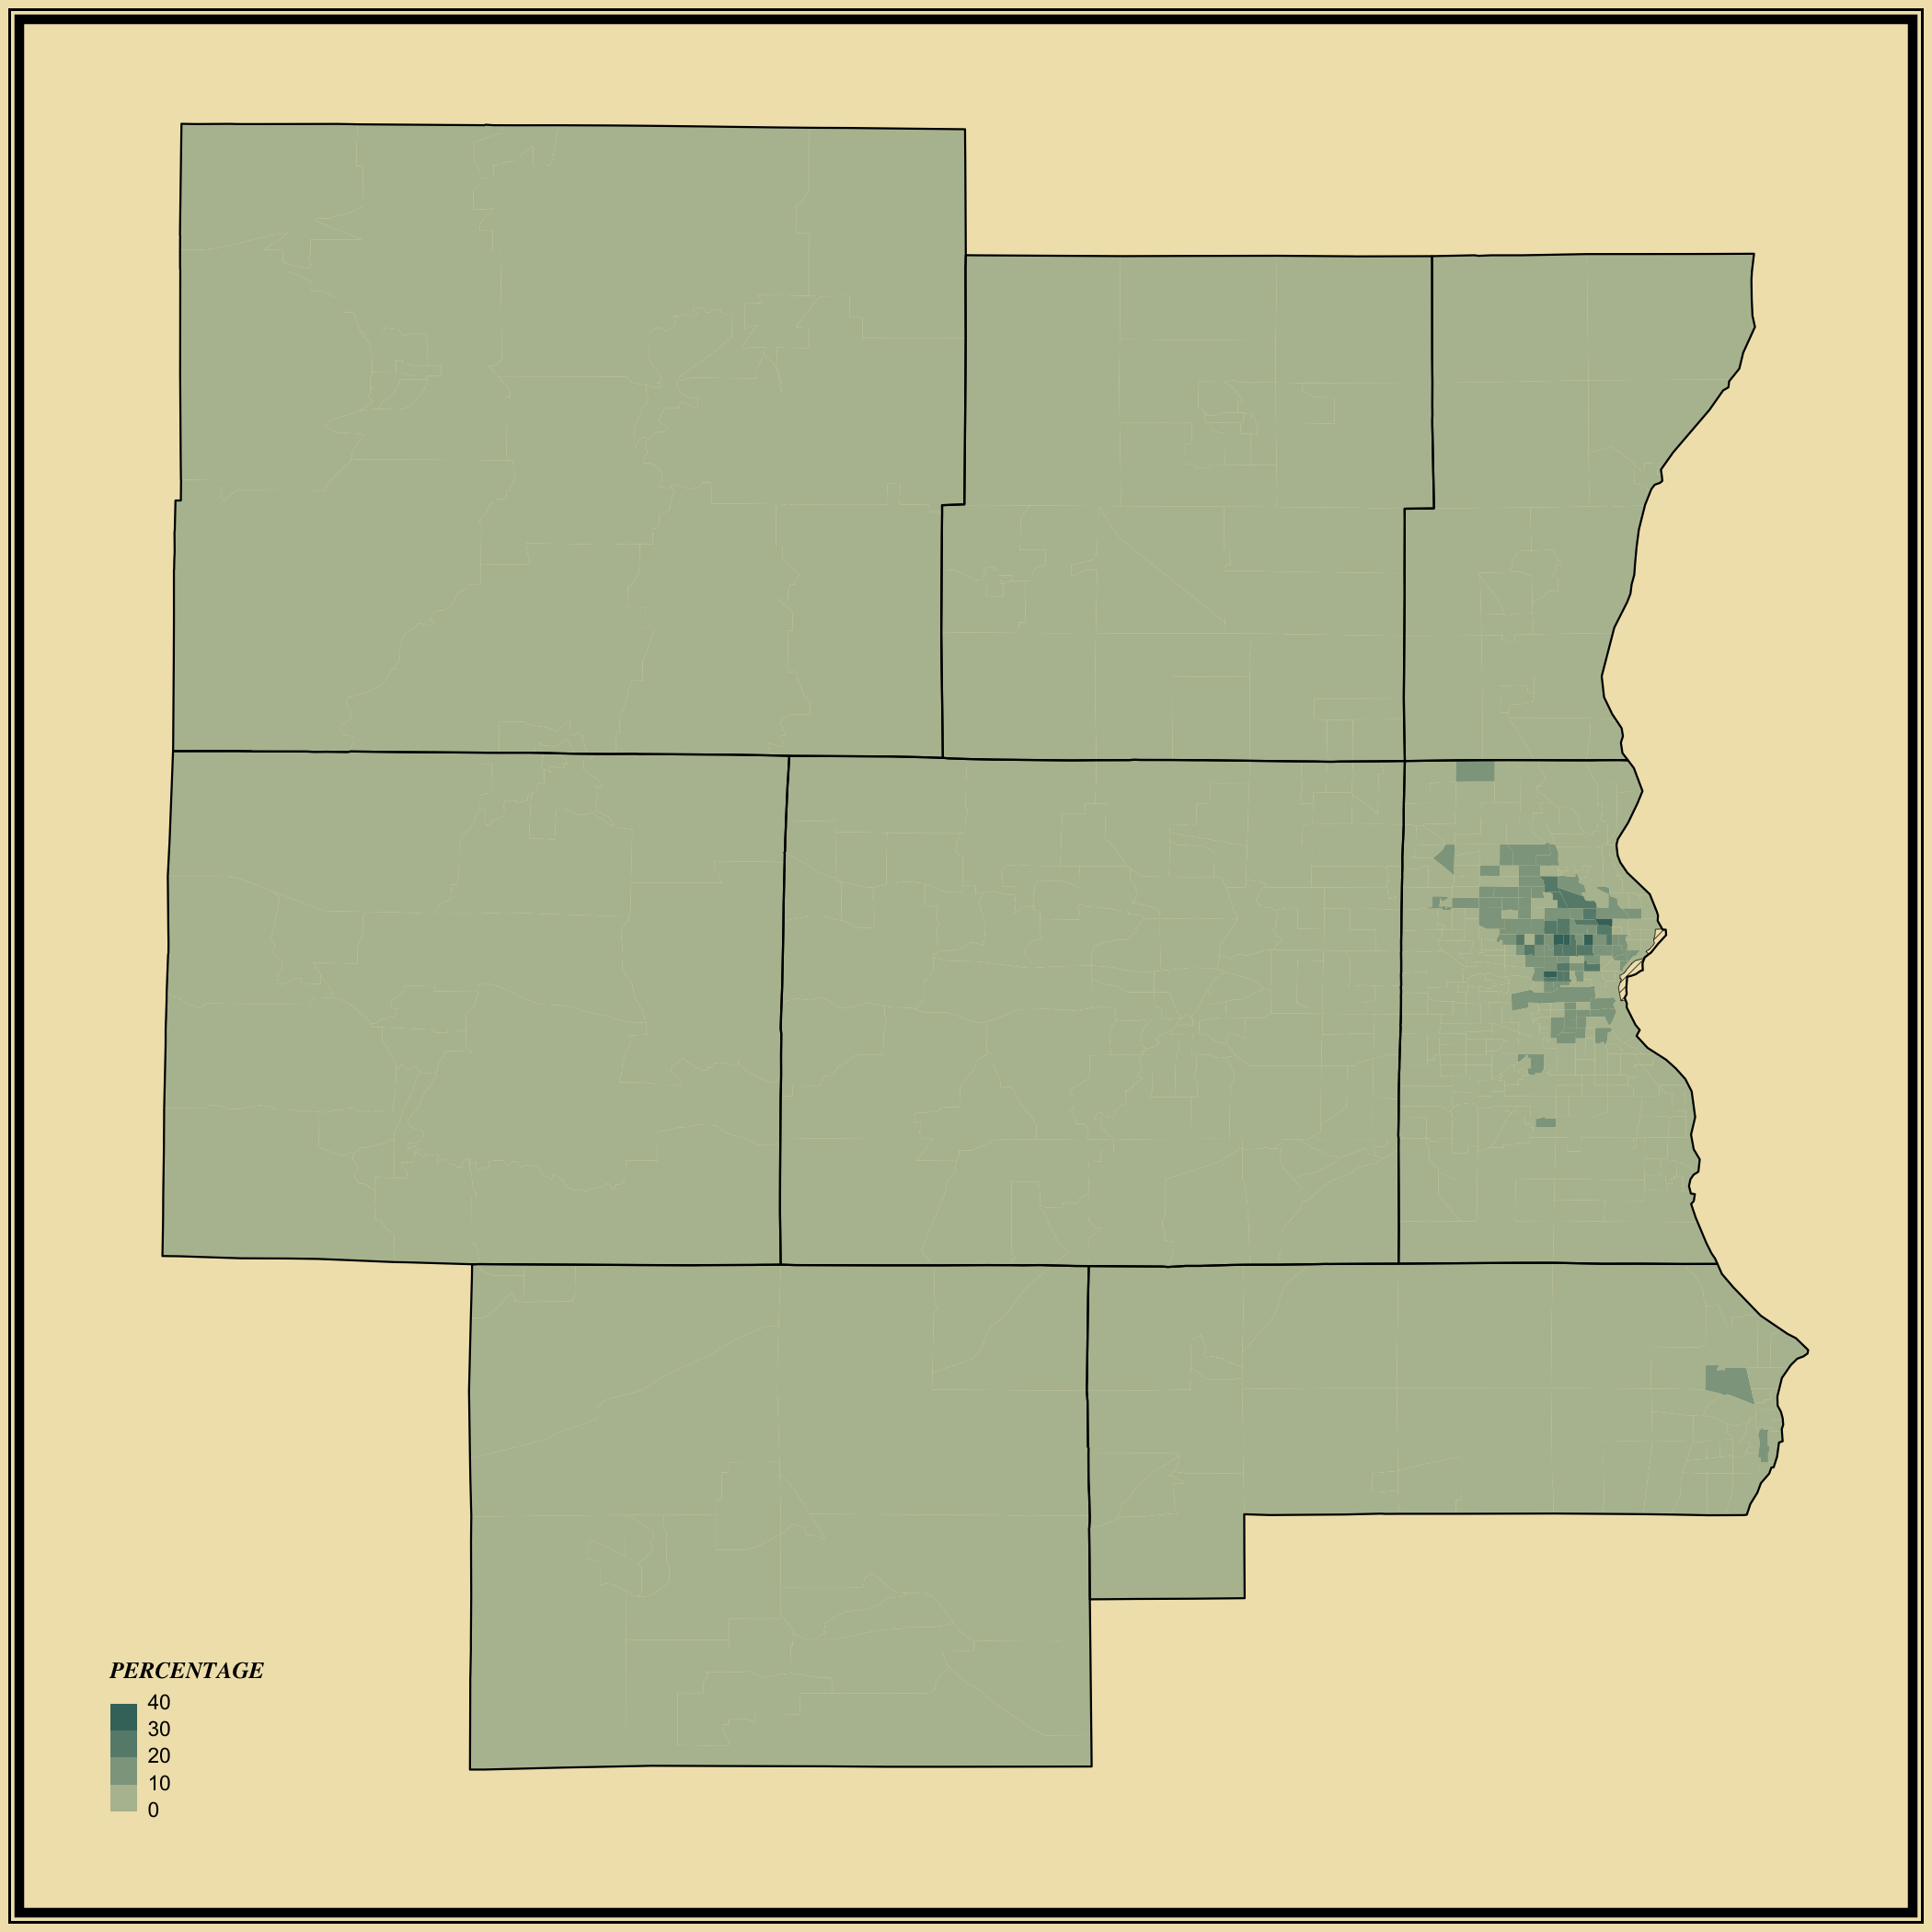
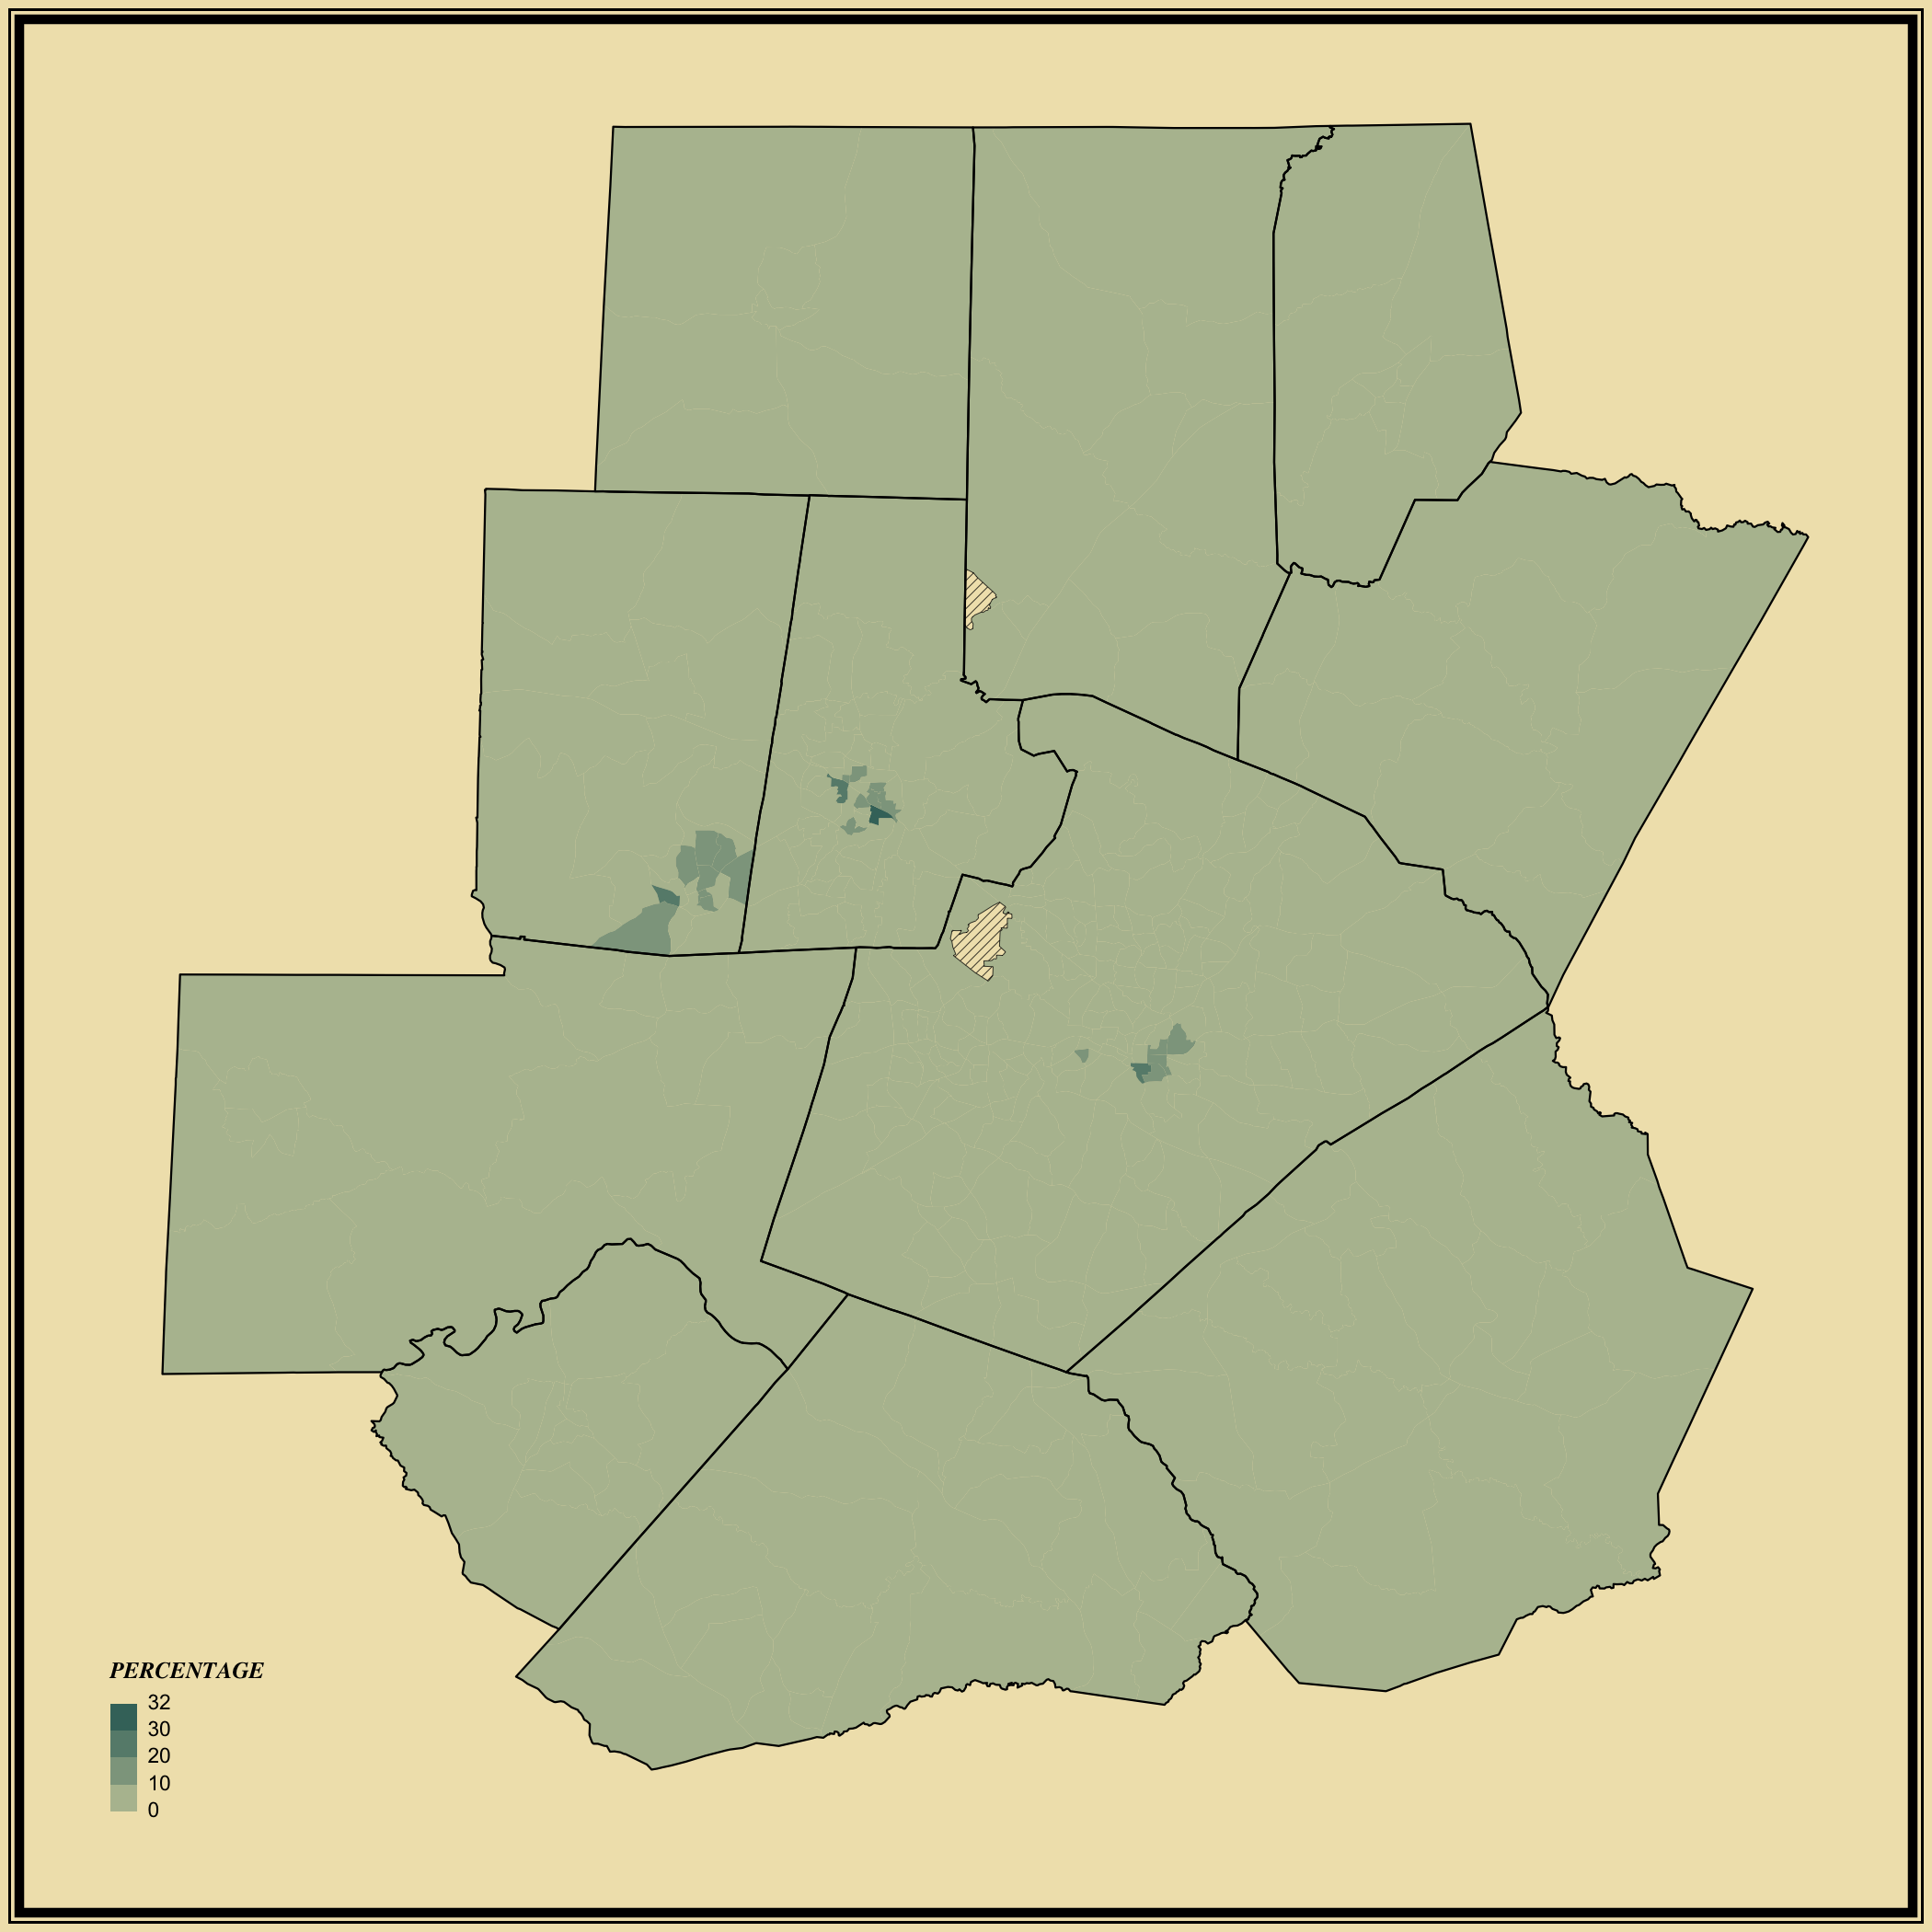
This set of choropleth maps shows the percentage of workers 16 years and over who take public transportation to work. Darker shades represent higher values.
As expected, public transportation is more common in cities, where there are more people and alternative transportation methods are available. This contrasts well with percentage of workers who drive alone in their commute.


