Projects and Experiments by FlowingData
Here are the results of mild insomnia and a restless mind. Some projects are maps, some are interactive, and some are applications.
Graphics


Famous Sci-fi Quotes
Nerd quotes as nerd graphics.
Interactives


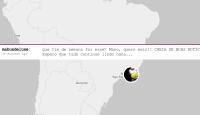
Inauguration on Twitter
Twitter was aflutter when President Barack Obama officially took the historic oath.
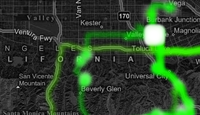
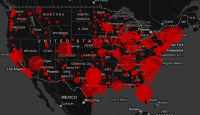
Growth of Walmart
My first interactive map using Modest Maps. Walmart's spread has been described as a virus, cancer, wildfire, and the plague.
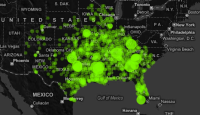
Growth of Target
Second in the growth map series. Target's growth looks more opportunistic than organic.
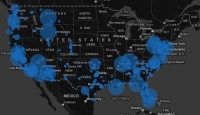
Growth of Ross Stores
Growth map of Ross. As seems to be common, there is slow growth in the beginning and then a sudden boom.
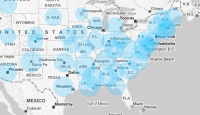
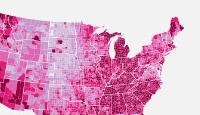
United States Poverty
A look at poverty rates between 1980 to 2007 according to the US Census Bureau.

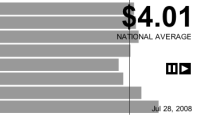
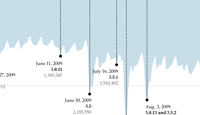
Gas Prices
Fluctuations in gas prices over the years. In 1993, the national cost per gallon was $1.07.